Shaw 2011 Annual Report Download - page 56
Download and view the complete annual report
Please find page 56 of the 2011 Shaw annual report below. You can navigate through the pages in the report by either clicking on the pages listed below, or by using the keyword search tool below to find specific information within the annual report.-
 1
1 -
2
-
3
-
4
-
5
-
6
-
7
-
8
-
9
-
10
-
11
-
12
-
13
-
14
-
15
-
16
-
17
-
18
-
19
-
20
-
21
-
22
-
23
-
24
-
25
-
26
-
27
-
28
-
29
-
30
-
31
-
32
-
33
-
34
-
35
-
36
-
37
-
38
-
39
-
40
-
41
-
42
-
43
-
44
-
45
-
 46
46 -
 47
47 -
 48
48 -
 49
49 -
 50
50 -
 51
51 -
 52
52 -
 53
53 -
 54
54 -
 55
55 -
 56
56 -
 57
57 -
 58
58 -
 59
59 -
 60
60 -
 61
61 -
 62
62 -
 63
63 -
 64
64 -
 65
65 -
 66
66 -
67
-
68
-
69
-
70
-
71
-
72
-
73
-
74
-
75
-
76
-
77
-
78
-
79
-
80
-
81
-
82
-
83
-
84
-
85
-
86
-
87
-
88
-
89
-
90
-
91
-
92
-
93
-
94
-
95
-
96
-
97
-
98
-
99
-
100
-
101
-
102
-
103
-
104
-
105
-
106
-
107
-
108
-
109
-
110
-
111
-
112
-
113
-
114
-
115
-
116
-
117
-
118
-
119
-
120
-
121
-
122
-
123
-
124
-
125
-
126
-
127
-
128
-
129
-
130
-
131
-
132
-
133
-
134
-
135
-
136
-
137
-
138
-
139
-
140
-
141
-
142
-
143
-
144
-
145
-
146
-
147
-
148
-
149
 |
 |

Shaw Communications Inc.
MANAGEMENT’S DISCUSSION AND ANALYSIS
August 31, 2011
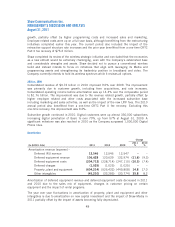
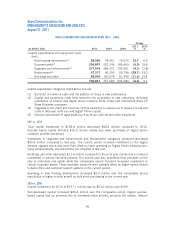
Earnings per share from continuing operations
Change
(In $000’s Cdn except per share amounts) 2011 2010 2009
2011
%
2010
%
Net income from continuing operations
attributable to common shareholders 542,964 533,776 536,475 1.7 (0.5)
Weighted average number of participating
shares outstanding during period (000’s) 434,881 432,675 429,153 0.5 0.8
Earnings per share from continuing
operations – basic and diluted $ 1.24 $ 1.23 $ 1.25 0.8 (1.6)
Net income from continuing operations
Net income from continuing operations was $562.1 million in 2011 compared to $533.8 million in
2010 and $536.5 million in 2009. The year-over-year changes are summarized in the table below.
In 2011 net income from continuing operations increased $28.3 million over the prior year. The
current year benefitted from improved operating income before amortization of $270.7 million
partially offset by higher interest, amortization, and income taxes of $83.6 million, $80.0 million,
and $21.3 million, respectively. The change in net other costs and revenue of $57.5 million also
reduced the current year and was primarily due to amounts related to the CRTC benefit obligation
and various acquisition, integration and restructuring costs partially offset by debt retirement costs
and amounts related to derivative instruments associated with the early redemption of the three
series of US senior notes in the prior year. The prior year operating income before amortization
included a one-time CRTC Part II fee recovery of $75.3 million which was offset in the current year
by amounts related to Shaw Media and growth in the Cable and Satellite divisions.
Net income from continuing operations in 2010 was comparable to 2009. Higher operating
income before amortization of $219.5 million, including the aforementioned one-time CRTC
Part II fee recovery, was offset by debt retirement costs of $81.6 million, loss on derivative
instruments of $45.2 million, higher interest expense of $11.0 million, increased amortization
of $73.0 million and a loss on equity investee of $11.3 million.
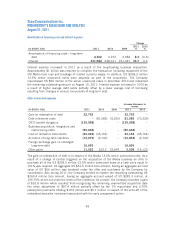
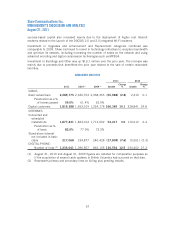
(In $millions Cdn) 2011 2010
Increased operating income before amortization 270.7 219.5
Decreased amortization of deferred equipment costs and revenue and IRU
revenue 10.0 6.1
Increased amortization of deferred charges, financing costs, property, plant
and equipment, and other intangibles (90.0) (79.1)
Increased interest expense (83.6) (11.0)
Change in other net costs and revenue(1) (57.5) (145.9)
Decreased (increased) income taxes (21.3) 7.7
28.3 (2.7)
(1) Other net costs and revenue include gain on redemption of debt, debt retirement costs,
CRTC benefit obligation, business acquisition, integration and restructuring expenses, loss
on derivative instruments, accretion of long-term liabilities, foreign exchange gain on
unhedged long-term debt, other gains and equity income (loss) on investees as detailed in
the Consolidated Statements of Income and Retained Earnings.
52