Shaw 2011 Annual Report Download - page 81
Download and view the complete annual report
Please find page 81 of the 2011 Shaw annual report below. You can navigate through the pages in the report by either clicking on the pages listed below, or by using the keyword search tool below to find specific information within the annual report.-
 1
1 -
2
-
3
-
4
-
5
-
6
-
7
-
8
-
9
-
10
-
11
-
12
-
13
-
14
-
15
-
16
-
17
-
18
-
19
-
20
-
21
-
22
-
23
-
24
-
25
-
26
-
27
-
28
-
29
-
30
-
31
-
32
-
33
-
34
-
35
-
36
-
37
-
38
-
39
-
40
-
41
-
42
-
43
-
44
-
45
-
46
-
47
-
48
-
49
-
50
-
51
-
52
-
53
-
54
-
55
-
56
-
57
-
58
-
59
-
60
-
61
-
62
-
63
-
64
-
65
-
66
-
67
-
68
-
69
-
70
-
 71
71 -
 72
72 -
 73
73 -
 74
74 -
 75
75 -
 76
76 -
 77
77 -
 78
78 -
 79
79 -
 80
80 -
 81
81 -
 82
82 -
 83
83 -
 84
84 -
 85
85 -
 86
86 -
 87
87 -
 88
88 -
 89
89 -
 90
90 -
 91
91 -
92
-
93
-
94
-
95
-
96
-
97
-
98
-
99
-
100
-
101
-
102
-
103
-
104
-
105
-
106
-
107
-
108
-
109
-
110
-
111
-
112
-
113
-
114
-
115
-
116
-
117
-
118
-
119
-
120
-
121
-
122
-
123
-
124
-
125
-
126
-
127
-
128
-
129
-
130
-
131
-
132
-
133
-
134
-
135
-
136
-
137
-
138
-
139
-
140
-
141
-
142
-
143
-
144
-
145
-
146
-
147
-
148
-
149
 |
 |

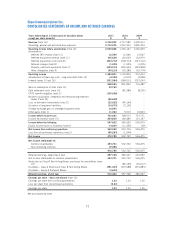
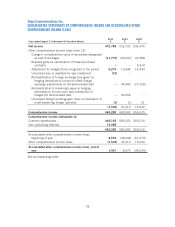
Shaw Communications Inc.
CONSOLIDATED STATEMENTS OF INCOME AND RETAINED EARNINGS
Years ended August 31 [thousands of Canadian dollars
except per share amounts]
2011
$
2010
$
2009
$
Revenue [note 16] 4,740,903 3,717,580 3,390,913
Operating, general and administrative expenses 2,710,075 1,957,433 1,850,304
Operating income before amortization [note 16] 2,030,828 1,760,147 1,540,609
Amortization –
Deferred IRU revenue [note 11] 12,546 12,546 12,547
Deferred equipment revenue [note 11] 106,628 120,639 132,974
Deferred equipment costs [note 8] (204,712) (228,714) (247,110)
Deferred charges [note 8] (1,025) (1,025) (1,025)
Property, plant and equipment [note 7] (604,214) (526,432) (449,808)
Other intangibles [note 9] (45,210) (33,285) (30,774)
Operating income 1,294,841 1,103,876 957,413
Amortization of financing costs – long-term debt [note 10] (4,302) (3,972) (3,984)
Interest [notes 10 and 16] (331,584) (248,011) (237,047)
958,955 851,893 716,382
Gain on redemption of debt [note 10] 32,752 ––
Debt retirement costs [note 10] –(81,585) (8,255)
CRTC benefit obligation [note 2] (139,098) ––
Business acquisition, integration and restructuring expenses
[notes 2 and 14] (90,648) ––
Loss on derivative instruments [note 21] (22,022) (45,164) –
Accretion of long-term liabilities (14,975) (2,142) –
Foreign exchange gain on unhedged long-term debt 16,695 ––
Other gains [note 1] 11,022 5,513 19,644
Income before income taxes 752,681 728,515 727,771
Income tax expense [note 15] 204,829 183,489 191,197
Income before the following 547,852 545,026 536,574
Equity income (loss) on investees [note 6] 14,200 (11,250) (99)
Net income from continuing operations 562,052 533,776 536,475
Loss from discontinued operations [note 2] (89,263) (1,044) –
Net income 472,789 532,732 536,475
Net income attributable to:
Common shareholders 453,701 532,732 536,475
Non-controlling interests 19,088 ––
472,789 532,732 536,475
Retained earnings, beginning of year 457,728 382,227 222,652
Net income attributable to common shareholders 453,701 532,732 536,475
Reduction on Class B Non-Voting Shares purchased for cancellation [note
12] –(85,143) (25,017)
Dividends – Class A Shares and Class B Non-Voting Shares (391,343) (372,088) (351,883)
Dividends – Series A Preferred Shares (3,624) ––
Retained earnings, end of year 516,462 457,728 382,227
Earnings per share – basic and diluted [note 12]
Earnings per share from continuing operations 1.24 1.23 1.25
Loss per share from discontinued operations (0.21) ––
Earnings per share 1.03 1.23 1.25
See accompanying notes
77