Shaw 2011 Annual Report Download - page 141
Download and view the complete annual report
Please find page 141 of the 2011 Shaw annual report below. You can navigate through the pages in the report by either clicking on the pages listed below, or by using the keyword search tool below to find specific information within the annual report.-
 1
1 -
2
-
3
-
4
-
5
-
6
-
7
-
8
-
9
-
10
-
11
-
12
-
13
-
14
-
15
-
16
-
17
-
18
-
19
-
20
-
21
-
22
-
23
-
24
-
25
-
26
-
27
-
28
-
29
-
30
-
31
-
32
-
33
-
34
-
35
-
36
-
37
-
38
-
39
-
40
-
41
-
42
-
43
-
44
-
45
-
46
-
47
-
48
-
49
-
50
-
51
-
52
-
53
-
54
-
55
-
56
-
57
-
58
-
59
-
60
-
61
-
62
-
63
-
64
-
65
-
66
-
67
-
68
-
69
-
70
-
71
-
72
-
73
-
74
-
75
-
76
-
77
-
78
-
79
-
80
-
81
-
82
-
83
-
84
-
85
-
86
-
87
-
88
-
89
-
90
-
91
-
92
-
93
-
94
-
95
-
96
-
97
-
98
-
99
-
100
-
101
-
102
-
103
-
104
-
105
-
106
-
107
-
108
-
109
-
110
-
111
-
112
-
113
-
114
-
115
-
116
-
117
-
118
-
119
-
120
-
121
-
122
-
123
-
124
-
125
-
126
-
127
-
128
-
129
-
130
-
 131
131 -
 132
132 -
 133
133 -
 134
134 -
 135
135 -
 136
136 -
 137
137 -
 138
138 -
 139
139 -
 140
140 -
 141
141 -
 142
142 -
 143
143 -
 144
144 -
 145
145 -
 146
146 -
 147
147 -
 148
148 -
 149
149
 |
 |

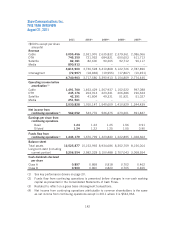
Shaw Communications Inc.
NOTES TO CONSOLIDATED FINANCIAL STATEMENTS
August 31, 2011, 2010 and 2009
[all amounts in thousands of Canadian dollars except share and per share amounts]
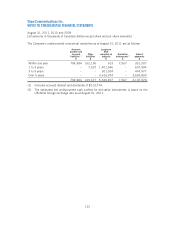
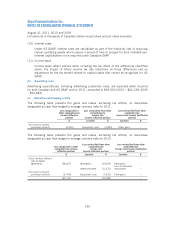
The cumulative effect of these adjustments on consolidated shareholders’ equity is as follows:
2011 2010
$$
Shareholders’ equity using Canadian GAAP 3,457,848 2,770,532
Amortization of intangible assets(1) (130,208) (130,208)
Deferred charges and credits(2) (8) (8,968) (6,173)
Business acquisitions(3) 133,224 (12,739)
Equity in loss of investee(4) (35,710) (35,710)
Gain on sale of subsidiary(5) 16,052 16,052
Gain on sale of cable systems(6) 50,063 50,063
Fair value of derivatives(7) 6,675 8,627
Capitalized interest(10) 24,559 11,748
Income taxes(11) 2,247 5,315
Accumulated other comprehensive loss (118,387) (108,503)
Shareholders’ equity using US GAAP 3,397,395 2,569,004
The adjustment to accumulated other comprehensive income (loss) is comprised of the
following:
2011 2010
$$
Fair value of derivatives(7) –(8,627)
Pension and post-retirement liabilities(9) (118,387) (99,876)
Accumulated other comprehensive loss (118,387) (108,503)
The estimated pension amount that will be amortized from accumulated other comprehensive
loss into income in 2012 includes an actuarial loss of $12,868 and past service costs of
$5,776.
Areas of material difference between Canadian and US GAAP and their impact on the
consolidated financial statements are as follows:
(1) Amortization of intangible assets
Until September 1, 2001, under Canadian GAAP amounts allocated to broadcast rights
were amortized using an increasing charge method which commenced in 1992. Under
US GAAP, these intangibles were amortized on a straight-line basis over 40 years.
Effective September 1, 2001, broadcast rights are considered to have an indefinite life
and are no longer amortized under Canadian and US GAAP.
137