Shaw 2011 Annual Report Download - page 140
Download and view the complete annual report
Please find page 140 of the 2011 Shaw annual report below. You can navigate through the pages in the report by either clicking on the pages listed below, or by using the keyword search tool below to find specific information within the annual report.-
 1
1 -
2
-
3
-
4
-
5
-
6
-
7
-
8
-
9
-
10
-
11
-
12
-
13
-
14
-
15
-
16
-
17
-
18
-
19
-
20
-
21
-
22
-
23
-
24
-
25
-
26
-
27
-
28
-
29
-
30
-
31
-
32
-
33
-
34
-
35
-
36
-
37
-
38
-
39
-
40
-
41
-
42
-
43
-
44
-
45
-
46
-
47
-
48
-
49
-
50
-
51
-
52
-
53
-
54
-
55
-
56
-
57
-
58
-
59
-
60
-
61
-
62
-
63
-
64
-
65
-
66
-
67
-
68
-
69
-
70
-
71
-
72
-
73
-
74
-
75
-
76
-
77
-
78
-
79
-
80
-
81
-
82
-
83
-
84
-
85
-
86
-
87
-
88
-
89
-
90
-
91
-
92
-
93
-
94
-
95
-
96
-
97
-
98
-
99
-
100
-
101
-
102
-
103
-
104
-
105
-
106
-
107
-
108
-
109
-
110
-
111
-
112
-
113
-
114
-
115
-
116
-
117
-
118
-
119
-
120
-
121
-
122
-
123
-
124
-
125
-
126
-
127
-
128
-
129
-
 130
130 -
 131
131 -
 132
132 -
 133
133 -
 134
134 -
 135
135 -
 136
136 -
 137
137 -
 138
138 -
 139
139 -
 140
140 -
 141
141 -
 142
142 -
 143
143 -
 144
144 -
 145
145 -
 146
146 -
 147
147 -
 148
148 -
 149
149
 |
 |

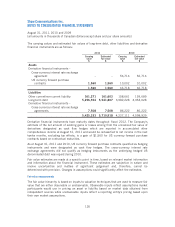
Shaw Communications Inc.
NOTES TO CONSOLIDATED FINANCIAL STATEMENTS
August 31, 2011, 2010 and 2009
[all amounts in thousands of Canadian dollars except share and per share amounts]
2011 2010 2009
$$$
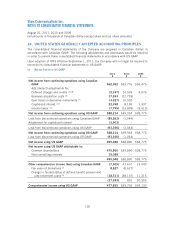
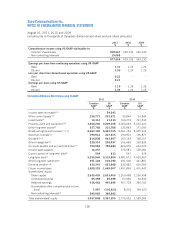
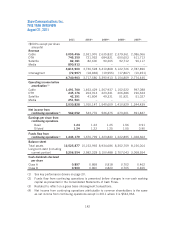
Comprehensive income using US GAAP attributable to:
Common shareholders 458,567 539,706 569,130
Non-controlling interests 19,088 ––
477,655 539,706 569,130
Earnings per share from continuing operations using US GAAP
Basic 1.31 1.25 1.26
Diluted 1.30 1.24 1.25
Loss per share from discontinued operations using US GAAP
Basic 0.21 ––
Diluted 0.21 ––
Earnings per share using US GAAP
Basic 1.10 1.25 1.26
Diluted 1.09 1.24 1.25
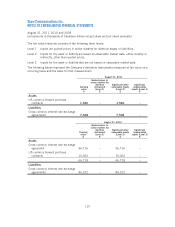
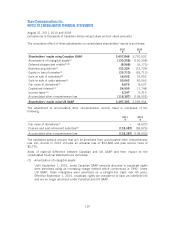
Consolidated Balance Sheet items using US GAAP
2011 2010
Canadian US Canadian US
GAAP GAAP GAAP GAAP
$$$$
Income taxes receivable(11) –24,243 ––
Other current assets(11) 236,771 232,571 33,844 33,844
Investments(3) 13,314 13,314 743,273 731,510
Property, plant and equipment(10) 3,200,200 3,209,158 3,004,649 3,010,222
Other long-term assets(2) 257,768 215,788 232,843 171,093
Broadcast rights and licenses(1) (5) (6) 6,467,369 6,442,135 5,061,153 5,035,919
Spectrum licenses(10) 190,912 207,815 190,912 196,877
Goodwill(3) (7) 814,808 942,807 169,143 168,167
Other intangibles(10) 229,314 236,497 156,469 160,839
Accounts payable and accrued liabilities(11) 794,984 789,484 623,070 623,070
Income taxes payable 12,357 – 170,581 149,081
Current portion of long-term debt(2) 594 613 557 576
Long-term debt(2) 5,255,960 5,319,844 3,981,671 4,020,457
Other long-term liabilities(9) 351,122 516,192 291,500 431,807
Deferred credits(2) (8) 630,341 623,868 632,482 629,000
Future income taxes 1,699,325 1,669,007 1,451,859 1,415,442
Shareholders’ equity:
Share capital 2,633,459 2,633,459 2,250,498 2,250,498
Contributed surplus 65,498 65,498 53,330 53,330
Retained earnings 516,462 445,696 457,728 364,703
Accumulated other comprehensive income
(loss) 1,467 (116,920) 8,976 (99,527)
Non-controlling interests(3) 240,962 369,662 ––
Total shareholders’ equity 3,457,848 3,397,395 2,770,532 2,569,004
136