Rogers 2010 Annual Report Download - page 99
Download and view the complete annual report
Please find page 99 of the 2010 Rogers annual report below. You can navigate through the pages in the report by either clicking on the pages listed below, or by using the keyword search tool below to find specific information within the annual report.-
 1
1 -
2
-
3
-
4
-
5
-
6
-
7
-
8
-
9
-
10
-
11
-
12
-
13
-
14
-
15
-
16
-
17
-
18
-
19
-
20
-
21
-
22
-
23
-
24
-
25
-
26
-
27
-
28
-
29
-
30
-
31
-
32
-
33
-
34
-
35
-
36
-
37
-
38
-
39
-
40
-
41
-
42
-
43
-
44
-
45
-
46
-
47
-
48
-
49
-
50
-
51
-
52
-
53
-
54
-
55
-
56
-
57
-
58
-
59
-
60
-
61
-
62
-
63
-
64
-
65
-
66
-
67
-
68
-
69
-
70
-
71
-
72
-
73
-
74
-
75
-
76
-
77
-
78
-
79
-
80
-
81
-
82
-
83
-
84
-
85
-
86
-
87
-
88
-
 89
89 -
 90
90 -
 91
91 -
 92
92 -
 93
93 -
 94
94 -
 95
95 -
 96
96 -
 97
97 -
 98
98 -
 99
99 -
 100
100 -
 101
101 -
 102
102 -
 103
103 -
 104
104 -
 105
105 -
 106
106 -
 107
107 -
 108
108 -
 109
109 -
110
-
111
-
112
-
113
-
114
-
115
-
116
-
117
-
118
-
119
-
120
 |
 |

NOTES TO CONSOLIDATED FINANCIAL STATEMENTS
ROGERS COMMUNICATIONS INC. 2010 ANNUAL REPORT 103
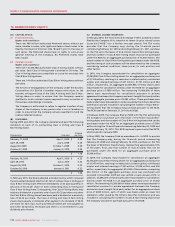
(C) LIQUIDITY RISK:
Liquidity risk is the risk that the Company will not be able to meet its
financial obligations as they fall due. The Company manages liquidity
risk through the management of its capital structure and financial
leverage, as outlined in note 21. It also manages liquidity risk by
continuously monitoring actual and projected cash flows to ensure that
it will have sufficient liquidity to meet its liabilities when due, under
both normal and stressed conditions, without incurring unacceptable
losses or risking damage to the Company’s reputation. At December 31,
2010, the undrawn portion of the Company’s bank credit facility was
approximately $2.4 billion (2009 – $2.4 billion), excluding letters of
credit of $94 million (2009 – $47 million).
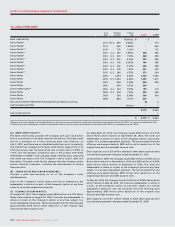
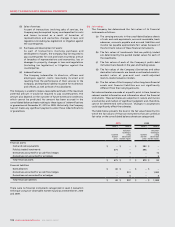
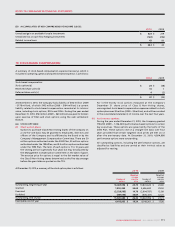
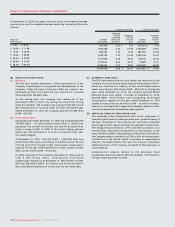
The following are the contractual maturities, excluding interest
payments, reflecting undiscounted disbursements of the Company’s
financial liabilities at December 31, 2010:
*Represents Canadian dollar equivalent amount of U.S. dollar inflows matched to an equal amount of U.S. dollar maturities in long-term debt.
(D) MARKET RISK:
Market risk is the risk that changes in market prices, such as fluctuations
in the market prices of the Company’s publicly traded investments, the
Company’s share price, foreign exchange rates and interest rates, will
affect the Company’s income or the value of its financial instruments.
(i) Publicly traded investments:
The Company manages its risk related to fluctuations in the market
prices of its publicly traded investments by regularly conducting
financial reviews of publicly available information related to these
investments to ensure that any risks are within established levels
of risk tolerance. The Company does not routinely engage in risk
management practices such as hedging, Derivatives or short selling
with respect to its publicly traded investments.
At December 31, 2010, a $1 change in the market price per share of
the Company’s publicly traded investments would have resulted in
a $14 million change in the Company’s other comprehensive
income, net of income taxes of $2 million.
(ii) Company’s share price:
In addition, market risk arises from accounting for the Company’s
stock-based compensation. All of the Company’s outstanding
stock options, RSUs and DSUs, are classified as liabilities and are
carried at their intrinsic value, as adjusted for vesting, measured as
the difference between the current share price and the respective
option, RSU and DSU exercise price, as applicable. The intrinsic
value of the liability is marked-to-market each period, and stock-
based compensation expense is impacted by the change in the
price of the Company’s Class B Non-Voting shares during the life of
the option, RSU and DSU. At December 31, 2010, a $1 change in the
market price of the Company’s Class B Non-Voting shares would
have resulted in a change of $6 million in net income.
(iii) Foreign exchange and interest rates:
The Company uses derivative financial instruments to manage risks
from fluctuations in exchange rates and interest rates related to its
U.S. dollar denominated debt instruments. From time-to-time,
these derivative financial instruments include cross-currency
swaps, interest rate exchange agreements, foreign exchange
forward contracts and foreign exchange option agreements. All
such instruments are only used for risk management purposes.
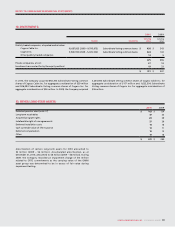
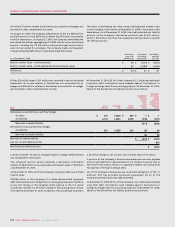
The effect of estimating fair value using credit-adjusted interest rates
on the Company’s Derivatives at December 31, 2010 is illustrated in the
table below. As at December 31, 2010, the credit-adjusted net liability
position of the Company’s Derivative portfolio was $900 million, which
is $17 million less than the unadjusted risk-free mark-to-market net
liability position.
As at December 31, 2010
Derivatives
in an asset
position (A)
Derivatives
in a liability
position (B)
Net liability
position
(A) + (B)
Mark-to-market value – risk-free analysis $ 7 $ (924) $ (917)
Mark-to-market value – credit-adjusted estimate (carrying value) 7(907) (900)
Difference $ – $ 17 $ 17
In addition to the amounts noted above, at December 31, 2010, net
interest payments over the life of the long-term debt, including the
impact of Derivatives, are: Less than 1
year
1 to 3
years
4 to 5
years
More than
5 years
Interest payments $ 645 $ 1,158 $ 864 $ 3,548
(In millions of dollars)
Carrying
amount
Contractual
cash flows
Less than
1 year
1 to 3
years
4 to 5
years
More than
5 years
Bank advances $ 40 $ 40 $ 40 $ – $ – $ –
Accounts payable and accrued liabilities 2,256 2,256 2,256 – – –
Income tax payable 376 376 376 – – –
Long-term debt 8,718 8,723 –1,164 1,920 5,639
Other long-term liabilities 64 64 –33 19 12
Derivatives:
Cash outflow (Canadian dollar) –5,907 –1,570 2,338 1,999
Cash inflow (Canadian dollar equivalent of U.S. dollar)* –(5,023)* –(1,164)* (1,920)* (1,939)*
Net carrying amounts of Derivatives 900
$ 12,354 $ 12,343 $ 2,672 $ 1,603 $ 2,357 $ 5,711