Rogers 2010 Annual Report Download - page 19
Download and view the complete annual report
Please find page 19 of the 2010 Rogers annual report below. You can navigate through the pages in the report by either clicking on the pages listed below, or by using the keyword search tool below to find specific information within the annual report.-
 1
1 -
2
-
3
-
4
-
5
-
6
-
7
-
8
-
 9
9 -
 10
10 -
 11
11 -
 12
12 -
 13
13 -
 14
14 -
 15
15 -
 16
16 -
 17
17 -
 18
18 -
 19
19 -
 20
20 -
 21
21 -
 22
22 -
 23
23 -
 24
24 -
 25
25 -
 26
26 -
 27
27 -
 28
28 -
 29
29 -
30
-
31
-
32
-
33
-
34
-
35
-
36
-
37
-
38
-
39
-
40
-
41
-
42
-
43
-
44
-
45
-
46
-
47
-
48
-
49
-
50
-
51
-
52
-
53
-
54
-
55
-
56
-
57
-
58
-
59
-
60
-
61
-
62
-
63
-
64
-
65
-
66
-
67
-
68
-
69
-
70
-
71
-
72
-
73
-
74
-
75
-
76
-
77
-
78
-
79
-
80
-
81
-
82
-
83
-
84
-
85
-
86
-
87
-
88
-
89
-
90
-
91
-
92
-
93
-
94
-
95
-
96
-
97
-
98
-
99
-
100
-
101
-
102
-
103
-
104
-
105
-
106
-
107
-
108
-
109
-
110
-
111
-
112
-
113
-
114
-
115
-
116
-
117
-
118
-
119
-
120
 |
 |

ROGERS COMMUNICATIONS INC. 2010 ANNUAL REPORT 23
MANAGEMENT’S DISCUSSION AND ANALYSIS OF FINANCIAL CONDITION AND RESULTS OF OPERATIONS
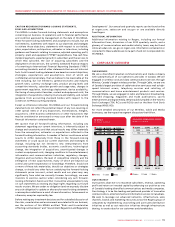
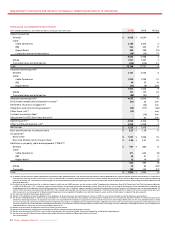
Of the $455 million year-over-year increase in our consolidated revenue,
Wireless contributed $314 million, Cable contributed $104 million and
Media contributed $94 million, offset by an increase in corporate items
and eliminations of $57 million.
Of the $265 million year-over-year increase in our consolidated adjusted
operating profit, Wireless contributed $125 million, Cable contributed
$113 million and Media contributed $28 million, offset by an increase in
corporate items and eliminations of $1 million.
Refer to the respective individual segment discussions for details of the
revenue, operating expenses, operating profit and additions to PP&E of
Wireless, Cable and Media.
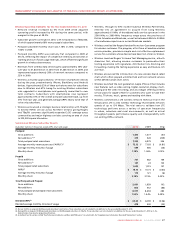
2010 Performance Against Targets
The following table sets forth the guidance ranges for selected full-
year financial and operating metrics that we provided for 2010 versus
the actual results we achieved for the year. We achieved performance
consistent with each of the financial objectives that were set forth
for 2010.
(In millions of dollars)
2009
Actual
2010GuidanceRange%
(As at February 17, 2010)
2010 Guidance Range $
(As at February 17, 2010)
2010
Actual
Consolidated
Adjusted operating profit(1) $ 4,388 Up 2% to 7% $ 4, 476 to $ 4, 695 $ 4,653
Additions to PP&E(2) $ 1,855 Flat to 5% $ 1,855 to $ 1,9 4 8 $ 1,839
Free cash flow(3) $ 1,886 Up 3% to 8% $ 1,943 to $ 2 ,037 $ 2,145
Cash income taxes
Assumptions for the timing
and amount of cash income
tax payments(4)
$ 8
~$150
~$150
$ 152
(1) Excludes stock-based compensation expense (recovery), integration and restructuring expenses, and other items (net).
(2) In addition to Wireless, Cable Operations and Media PP&E expenditures, consolidated additions to PP&E includes RBS, Rogers Retail and Corporate.
(3) Pre-tax free cash flow is defined as adjusted operating profit less PP&E expenditures and interest expense and is not a term defined under Canadian GAAP.
(4) Management currently expects to be fully cash taxable in the 2012 timeframe.
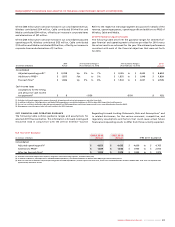
2011 FINANCIAL AND OPERATING GUIDANCE
The following table outlines guidance ranges and assumptions for
selected 2011 financial metrics. This information is forward-looking and
should be read in conjunction with the section entitled “Caution
Regarding Forward-Looking Statements, Risks and Assumptions” and
in related disclosures, for the various economic, competitive, and
regulatory assumptions and factors that could cause actual future
financial and operating results to differ from those currently expected.
(In millions of dollars)
GAAP 2010
Actual IFRS 2010
Actual IFRS 2011 Guidance
Consolidated
Adjusted operating profit(1) $ 4,653 $ 4,635 $ 4,600 to $ 4,765
Additions to PP&E(2) $ 1,839 $ 1,842 $ 1,950 to $ 2,050
After-tax free cash flow(3) $ 1,993 $ 1,972 $ 1,850 to $ 1,975
Full Year 2011 Guidance
(1) Excludes stock-based compensation expense, integration and restructuring expenses, and other items (net).
(2) In addition to Wireless, Cable Operations and Media PP&E expenditures, consolidated additions to PP&E includes RBS, Rogers Retail and Corporate.
(3) After-tax cash flow is defined as adjusted operating profit less PP&E expenditures, interest expense and cash taxes, and is not a term defined under Canadian GAAP or IFRS. Cash taxes are expected to be
approximately $90 million in 2011.