Rogers 2010 Annual Report Download - page 101
Download and view the complete annual report
Please find page 101 of the 2010 Rogers annual report below. You can navigate through the pages in the report by either clicking on the pages listed below, or by using the keyword search tool below to find specific information within the annual report.-
 1
1 -
2
-
3
-
4
-
5
-
6
-
7
-
8
-
9
-
10
-
11
-
12
-
13
-
14
-
15
-
16
-
17
-
18
-
19
-
20
-
21
-
22
-
23
-
24
-
25
-
26
-
27
-
28
-
29
-
30
-
31
-
32
-
33
-
34
-
35
-
36
-
37
-
38
-
39
-
40
-
41
-
42
-
43
-
44
-
45
-
46
-
47
-
48
-
49
-
50
-
51
-
52
-
53
-
54
-
55
-
56
-
57
-
58
-
59
-
60
-
61
-
62
-
63
-
64
-
65
-
66
-
67
-
68
-
69
-
70
-
71
-
72
-
73
-
74
-
75
-
76
-
77
-
78
-
79
-
80
-
81
-
82
-
83
-
84
-
85
-
86
-
87
-
88
-
89
-
90
-
 91
91 -
 92
92 -
 93
93 -
 94
94 -
 95
95 -
 96
96 -
 97
97 -
 98
98 -
 99
99 -
 100
100 -
 101
101 -
 102
102 -
 103
103 -
 104
104 -
 105
105 -
 106
106 -
 107
107 -
 108
108 -
 109
109 -
 110
110 -
 111
111 -
112
-
113
-
114
-
115
-
116
-
117
-
118
-
119
-
120
 |
 |

NOTES TO CONSOLIDATED FINANCIAL STATEMENTS
ROGERS COMMUNICATIONS INC. 2010 ANNUAL REPORT 105
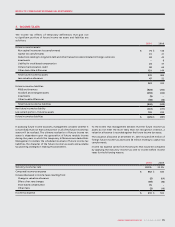
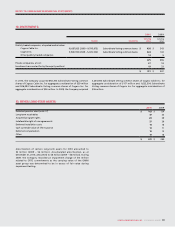
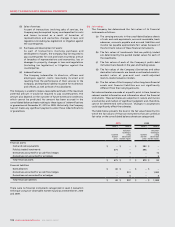
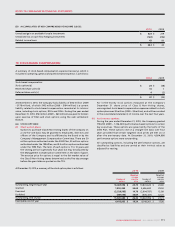
(E) FINANCIAL INSTRUMENTS:
(i) Classification and fair values of financial instruments:
The Company has classified its financial instruments as follows:
The Company did not have any non-derivative held-to-maturity
financial assets during the years ended December 31, 2010
and 2009.
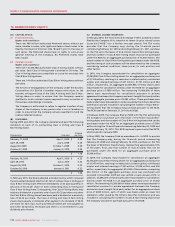
(ii) Guarantees:
In the normal course of business, the Company has entered into
agreements that contain features that meet the definition of a
guarantee under GAAP. A description of the major types of such
agreements is provided below:
(a) Business sale and business combination agreements:
As part of transactions involving business dispositions,
sales of assets or other business combinations, the
Company may be required to pay counterparties for costs
and losses incurred as a result of breaches of
representations and warranties, intellectual property
right infringement, loss or damages to property,
environmental liabilities, changes in laws and regulations
(including tax legislation), litigation against the
counterparties, contingent liabilities of a disposed
business or reassessments of previous tax filings of the
corporation that carries on the business.
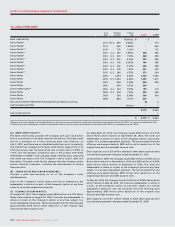
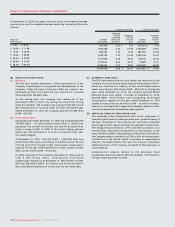
2009
U.S. $
notional
Exchange
rate
Cdn. $
notional
Unadjusted
mark-to market
value on a risk
free basis
Estimated fair value,
being carrying
amount on a credit
risk adjusted basis
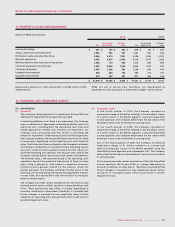
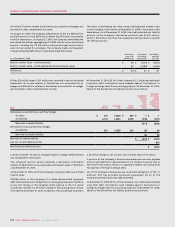
Derivatives accounted for as cash flow hedges:
As assets $ 1,975 1.0252 $ 2,025 $ 84 $ 73
As liabilities 3,215 1.3337 4,288 (1,117) (1,080)
Net mark-to-market liability (1,033) (1,007)
Derivatives not accounted for as hedges:
As assets 350 1.0258 359 10 9
As liabilities 10 1.5370 15 (4) (4)
Net mark-to-market asset 6 5
Net mark-to-market liability $ (1,027) $ (1,002)
Less net current liability portion (76)
Net long-term liability portion $ (926)
2010 2009
Carrying
amount
Fair
value
Carrying
amount
Fair
value
Cash and cash equivalents, held-for-trading, measured at fair value $ – $ – $ 383 $ 383
Financial assets, available-for-sale, measured at fair value:
Investments 675 675 496 496
Loans and receivables, measured at amortized cost:
Accounts receivable 1,480 1,480 1,310 1,310
$ 2,155 $ 2,155 $ 2,189 $ 2,189
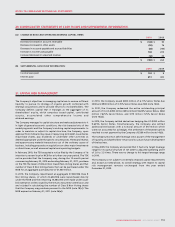
2010 2009
Carrying
amount
Fair
value
Carrying
amount
Fair
value
Financial liabilities, measured at amortized cost:
Bank advances $ 40 $ 40 $ – $ –
Accounts payable and accrued liabilities 2,256 2,256 2,175 2,175
Income tax payable 376 376 208 208
Long-term debt 8,718 9,688 8,464 9,315
Other long-term liabilities 64 64 76 76
Financial liabilities (assets), held-for-trading:
Derivatives not accounted for as hedges 6 6 (5) (5)
Derivatives accounted for as cash flow hedges, net 894 894 1,007 1,007
$ 12,354 $ 13,324 $ 11,925 $ 12,776