Rogers 2010 Annual Report Download - page 46
Download and view the complete annual report
Please find page 46 of the 2010 Rogers annual report below. You can navigate through the pages in the report by either clicking on the pages listed below, or by using the keyword search tool below to find specific information within the annual report.-
 1
1 -
2
-
3
-
4
-
5
-
6
-
7
-
8
-
9
-
10
-
11
-
12
-
13
-
14
-
15
-
16
-
17
-
18
-
19
-
20
-
21
-
22
-
23
-
24
-
25
-
26
-
27
-
28
-
29
-
30
-
31
-
32
-
33
-
34
-
35
-
 36
36 -
 37
37 -
 38
38 -
 39
39 -
 40
40 -
 41
41 -
 42
42 -
 43
43 -
 44
44 -
 45
45 -
 46
46 -
 47
47 -
 48
48 -
 49
49 -
 50
50 -
 51
51 -
 52
52 -
 53
53 -
 54
54 -
 55
55 -
 56
56 -
57
-
58
-
59
-
60
-
61
-
62
-
63
-
64
-
65
-
66
-
67
-
68
-
69
-
70
-
71
-
72
-
73
-
74
-
75
-
76
-
77
-
78
-
79
-
80
-
81
-
82
-
83
-
84
-
85
-
86
-
87
-
88
-
89
-
90
-
91
-
92
-
93
-
94
-
95
-
96
-
97
-
98
-
99
-
100
-
101
-
102
-
103
-
104
-
105
-
106
-
107
-
108
-
109
-
110
-
111
-
112
-
113
-
114
-
115
-
116
-
117
-
118
-
119
-
120
 |
 |

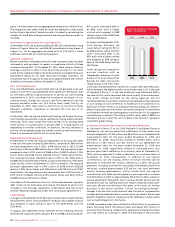
50 ROGERS COMMUNICATIONS INC. 2010 ANNUAL REPORT
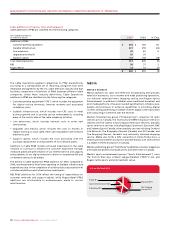
Long-term Debt Plus Net Derivative Liabilities
The aggregate of our long-term debt plus net derivative liabilities at
the mark-to-market values using risk-free analysis (“the risk-free
analytical value”) is used by us and many analysts to most closely
represent our net debt-related obligations for valuation purposes, and
is calculated as follows:
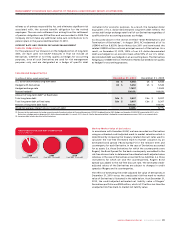
(In millions of dollars)
Derivatives in an
asset position (A) Derivatives in a
liability position (B) Net liability
position (A+B)
Mark-to-market value – risk-free analysis $ 7 $ (924) $ (917)
Mark-to-market value – credit adjusted estimate ( carrying value) $ 7 $ (907) $ (900)
Difference $ – $ 17 $ 17
(In millions of dollars) December 31, 2010 December 31, 2009
Long-term debt(1) $ 8,718 $ 8,464
Net derivative liabilities at the
risk-free analytical value(1) $ 917 $ 1,027
Total $ 9,635 $ 9,491
(1) Includes current and long-term portions.
We believe that the non-GAAP financial measure of long-term debt
plus net derivative liabilities (assets) at the risk-free analytical value
provides the most relevant and practical measure of our outstanding
net debt-related obligations. We use this non-GAAP measure internally
to conduct valuation-related analysis and make capital structure-
related decisions and it is reviewed regularly by management. It is also
useful to investors and analysts in enabling them to analyze the
enterprise and equity value of the Company and to assess various
leverage ratios as performance measures. This non-GAAP measure does
not have a standardized meaning and should be viewed as a supplement
to, and not a substitute for, our results of operations or financial
position reported under Canadian and U.S. GAAP.
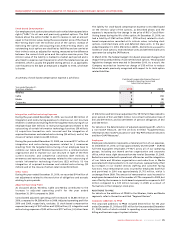
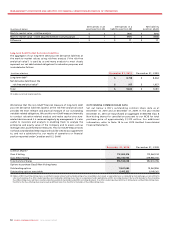
OUTSTANDING COMMON SHARE DATA
Set out below is RCI’s outstanding common share data as at
December 31, 2010 and at December 31, 2009. In the year ended
December31,2010 we repurchased an aggregate 37,080,906 Class B
Non-Voting shares for cancellation pursuant to our NCIB for total
purchase price of approximately $1,312 million. For additional
information, refer to Note 18 to our 2010 Audited Consolidated
Financial Statements.
(1) Holders of RCI’s Class B Non-Voting shares are entitled to receive notice of and to attend meetings of our shareholders, but, except as required by law or as stipulated by stock exchanges, are not entitled to
vote at such meetings. If an offer is made to purchase outstanding Class A Voting shares, there is no requirement under applicable law or RCI’s constating documents that an offer be made for the outstanding
Class B Non-Voting shares and there is no other protection available to shareholders under RCI’s constating documents. If an offer is made to purchase both Class A Voting shares and Class B Non-Voting shares,
the offer for the Class A Voting shares may be made on different terms than the offer to the holders of Class B Non-Voting shares.
December 31, 2010 December 31, 2009
Common Shares(1)
Class A Voting 112,462,014 112,462,014
Class B Non-Voting 443,072,044 479,948,041
Total Common Shares 555,534,058 592,410,055
Options to purchase Class B Non-Voting shares
Outstanding options 11,841,680 13,467,096
Outstanding options exercisable 6,415,933 8,149,361
MANAGEMENT’S DISCUSSION AND ANALYSIS OF FINANCIAL CONDITION AND RESULTS OF OPERATIONS