Rogers 2010 Annual Report Download - page 75
Download and view the complete annual report
Please find page 75 of the 2010 Rogers annual report below. You can navigate through the pages in the report by either clicking on the pages listed below, or by using the keyword search tool below to find specific information within the annual report.-
 1
1 -
2
-
3
-
4
-
5
-
6
-
7
-
8
-
9
-
10
-
11
-
12
-
13
-
14
-
15
-
16
-
17
-
18
-
19
-
20
-
21
-
22
-
23
-
24
-
25
-
26
-
27
-
28
-
29
-
30
-
31
-
32
-
33
-
34
-
35
-
36
-
37
-
38
-
39
-
40
-
41
-
42
-
43
-
44
-
45
-
46
-
47
-
48
-
49
-
50
-
51
-
52
-
53
-
54
-
55
-
56
-
57
-
58
-
59
-
60
-
61
-
62
-
63
-
64
-
 65
65 -
 66
66 -
 67
67 -
 68
68 -
 69
69 -
 70
70 -
 71
71 -
 72
72 -
 73
73 -
 74
74 -
 75
75 -
 76
76 -
 77
77 -
 78
78 -
 79
79 -
 80
80 -
 81
81 -
 82
82 -
 83
83 -
 84
84 -
 85
85 -
86
-
87
-
88
-
89
-
90
-
91
-
92
-
93
-
94
-
95
-
96
-
97
-
98
-
99
-
100
-
101
-
102
-
103
-
104
-
105
-
106
-
107
-
108
-
109
-
110
-
111
-
112
-
113
-
114
-
115
-
116
-
117
-
118
-
119
-
120
 |
 |

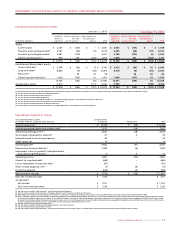
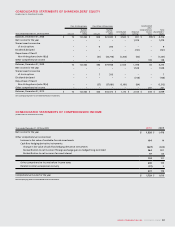
ROGERS COMMUNICATIONS INC. 2010 ANNUAL REPORT 79
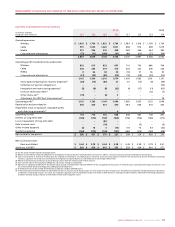
MANAGEMENT’S DISCUSSION AND ANALYSIS OF FINANCIAL CONDITION AND RESULTS OF OPERATIONS
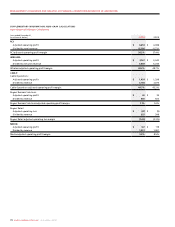
Wireless Non-GAAP Calculations(1)
Calculations of Adjusted Operating Profit, Net Income and Earnings
Per Share
Years ended December 31,
(In millions of dollars, number of shares outstanding in millions) 2010 2009
Operating profit $ 4,552 $ 4,316
Add (deduct):
Stock-based compensation expense (recovery) 47 (33)
Settlement of pension obligations – 30
Integration and restructuring expenses 40 117
Other items, net 14 –
Contract termination fees – 19
Adjustment for CRTC Part II fees decision –(61)
Adjusted operating profit $ 4,653 $ 4,388
Net income $ 1,528 $ 1,478
Add (deduct):
Stock-based compensation expense (recovery) 47 (33)
Settlement of pension obligations –30
Integration and restructuring expenses 40 117
Other items, net 14 –
Contract termination fees –19
Adjustment for CRTC Part II fees decision –(61)
Debt issuance costs 10 11
Loss on repayment of long-term debt 87 7
Impairment losses on goodwill, intangible assets
and other long-term assets 6 18
Income tax impact of above items (60) (30)
Income tax charge, cash-settled stock options 35 –
Adjusted net income $ 1,707 $ 1,556
Adjusted basic and diluted earnings per share:
Adjusted net income $ 1,707 $ 1,556
Divided by: weighted average number
of shares outstanding 576 621
Adjusted basic and diluted earnings per share $ 2.96 $ 2.51
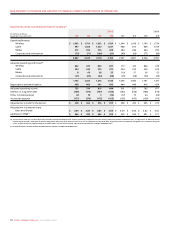
Years ended December 31,
(In millions of dollars, subscribers in thousands, except ARPU figures and adjusted operating profit margin) 2010 2009
Postpaid ARPU (monthly)
Postpaid (voice and data) revenue $ 6,272 $ 5,948
Divided by: average postpaid wireless voice and data subscribers 7,148 6,705
Divided by: 12 months 12 12
$ 73.12 $ 73.93
Prepaid ARPU (monthly)
Prepaid (voice and data) revenue $ 297 $ 297
Divided by: average prepaid subscribers 1,537 1,479
Divided by: 12 months 12 12
$ 16.10 $ 16.73
Blended ARPU (monthly)
Voice and data revenue $ 6,569 $ 6,245
Divided by: average wireless voice and data subscribers 8,685 8,18 4
Divided by: 12 months 12 12
$ 63.03 $ 63.59
(1) For definitions of key performance indicators and non-GAAP measures, see the section entitled “Key Performance Indicators and Non-GAAP Measures”.