Rogers 2010 Annual Report Download - page 24
Download and view the complete annual report
Please find page 24 of the 2010 Rogers annual report below. You can navigate through the pages in the report by either clicking on the pages listed below, or by using the keyword search tool below to find specific information within the annual report.-
 1
1 -
2
-
3
-
4
-
5
-
6
-
7
-
8
-
9
-
10
-
11
-
12
-
13
-
 14
14 -
 15
15 -
 16
16 -
 17
17 -
 18
18 -
 19
19 -
 20
20 -
 21
21 -
 22
22 -
 23
23 -
 24
24 -
 25
25 -
 26
26 -
 27
27 -
 28
28 -
 29
29 -
 30
30 -
 31
31 -
 32
32 -
 33
33 -
 34
34 -
35
-
36
-
37
-
38
-
39
-
40
-
41
-
42
-
43
-
44
-
45
-
46
-
47
-
48
-
49
-
50
-
51
-
52
-
53
-
54
-
55
-
56
-
57
-
58
-
59
-
60
-
61
-
62
-
63
-
64
-
65
-
66
-
67
-
68
-
69
-
70
-
71
-
72
-
73
-
74
-
75
-
76
-
77
-
78
-
79
-
80
-
81
-
82
-
83
-
84
-
85
-
86
-
87
-
88
-
89
-
90
-
91
-
92
-
93
-
94
-
95
-
96
-
97
-
98
-
99
-
100
-
101
-
102
-
103
-
104
-
105
-
106
-
107
-
108
-
109
-
110
-
111
-
112
-
113
-
114
-
115
-
116
-
117
-
118
-
119
-
120
 |
 |

MANAGEMENT’S DISCUSSION AND ANALYSIS OF FINANCIAL CONDITION AND RESULTS OF OPERATIONS
28 ROGERS COMMUNICATIONS INC. 2010 ANNUAL REPORT
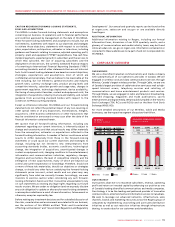
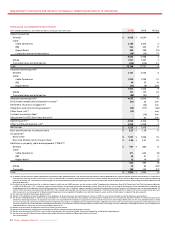
Wireless Subscribers and Network Revenue
The year-over-year decrease in total net subscriber additions for the
year primarily reflects an increase in the level of postpaid churn
associated with heightened competitive intensity, partially offset by
increased gross additions of prepaid subscribers.
Included in postpaid additions are a record number of new smartphone
subscriber sales. The increase in prepaid subscriber additions was the
result of Wireless’ launch of its urban zone-based unlimited voice and
text ‘chatr’ product and also its continued offering from earlier in the
summer of prepaid wireless service plans for the Apple iPad. In addition,
Wireless introduced prepaid Rocket stick wireless data plans that offer
the same speed and reliability as existing postpaid plans but are
designed for customers seeking the convenience of prepaid online
credit card activation without term contracts.
During 2010, we acquired British Columbia based wireless service
reseller Cityfone, a wholesale customer of Wireless. The Cityfone
customer base of approximately 44,000 subscribers was added as an
adjustment to Wireless’ postpaid subscriber base during the year. In
addition, we signed a strategic business relationship with TBayTel to
extend HSPA+ service across Northern Ontario, and migrated 17,000
postpaid subscribers and 10,000 prepaid subscribers to TBayTel.
The increase in network revenue in 2010 compared to 2009 was driven
predominantly by the continued growth of Wireless’ postpaid
subscriber base and the continued adoption of wireless data services.
Year-over-year blended ARPU decreased by 0.9%, which reflects
declines in roaming, out-of-plan usage and network access fees, offset
by higher wireless data and other ancillary revenues. These decreases
reflect a combination of factors, including the creation over the past
year of voice and data roaming value plans for frequent travelers, and
general competitive intensity.
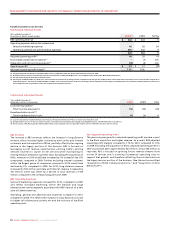
During2010,wirelessdatarevenueincreasedbyapproximately34%
from 2009, to $1,834 million. This growth in wireless data revenue
reflects the continued penetration and growing usage of smartphone
and wireless laptop devices which are driving increased usage of e-mail,
wireless Internet access, text messaging and other wireless data
services.In2010,datarevenuerepresentedapproximately28%oftotal
networkrevenue,comparedto22%in2009.
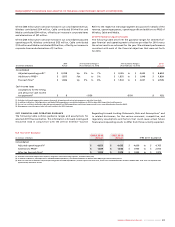
During 2010, Wireless activated
and upgraded approximately
1.9 million smartphones,
compared to approximately 1.5
million smartphones during
2009. These smartphones were
predominately iPhone,
BlackBerry and Android devices,
of which approximately 33%
were for subscribers new to
Wireless. This resulted in
subscribers with smartphones
representing41%oftheoverall
postpaid subscriber base as at
December 31, 2010, compared to
31% as at December 31, 2009.
These subscribers generally
commit to new multi-year-term
contracts, and typically generate
ARPU nearly twice that of voice
only subscribers. This is the
largest number of smartphone
activations and new smartphone customer additions that Wireless has
ever reported.
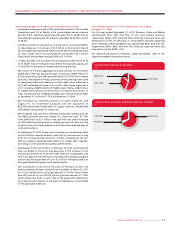
Wireless Equipment Sales
The year-over-year decrease in revenue from equipment sales, including
activation fees and net of equipment subsidies for 2010, reflects the
higher smartphone subsidy levels, which offset the increase in the
number of smartphone activations.
20102009
2008
2008
201
0
2009
41.0%31.0%19.0%
SMARTPHONES AS A PERCENT
OF POSTPAID SUBSCRIBERS
20102009
2008
2009
200
8
201
0
7,3256,451
1,652
6,979
1,5151,491
Postpaid Prepaid
WIRELESS POSTPAID AND
PREPAID SUBSCRIBERS
(In thousands)
20102009
2008
2008
201
0
2009
$1,834$1,366$946
WIRELESS DATA
REVENUE
(In millions of dollars)
20102009
2008
2009
200
8
201
0
$6,569$6,245$5,843
WIRELESS NETWORK
REVENUE
(In millions of dollars)
20102009
2008
2008
201
0
2009
27.9%21.9%16.4%
DATA REVENUE PERCENT
OF BLENDED ARPU