Rogers 2010 Annual Report Download - page 17
Download and view the complete annual report
Please find page 17 of the 2010 Rogers annual report below. You can navigate through the pages in the report by either clicking on the pages listed below, or by using the keyword search tool below to find specific information within the annual report.-
 1
1 -
2
-
3
-
4
-
5
-
6
-
 7
7 -
 8
8 -
 9
9 -
 10
10 -
 11
11 -
 12
12 -
 13
13 -
 14
14 -
 15
15 -
 16
16 -
 17
17 -
 18
18 -
 19
19 -
 20
20 -
 21
21 -
 22
22 -
 23
23 -
 24
24 -
 25
25 -
 26
26 -
 27
27 -
28
-
29
-
30
-
31
-
32
-
33
-
34
-
35
-
36
-
37
-
38
-
39
-
40
-
41
-
42
-
43
-
44
-
45
-
46
-
47
-
48
-
49
-
50
-
51
-
52
-
53
-
54
-
55
-
56
-
57
-
58
-
59
-
60
-
61
-
62
-
63
-
64
-
65
-
66
-
67
-
68
-
69
-
70
-
71
-
72
-
73
-
74
-
75
-
76
-
77
-
78
-
79
-
80
-
81
-
82
-
83
-
84
-
85
-
86
-
87
-
88
-
89
-
90
-
91
-
92
-
93
-
94
-
95
-
96
-
97
-
98
-
99
-
100
-
101
-
102
-
103
-
104
-
105
-
106
-
107
-
108
-
109
-
110
-
111
-
112
-
113
-
114
-
115
-
116
-
117
-
118
-
119
-
120
 |
 |

ROGERS COMMUNICATIONS INC. 2010 ANNUAL REPORT 21
MANAGEMENT’S DISCUSSION AND ANALYSIS OF FINANCIAL CONDITION AND RESULTS OF OPERATIONS
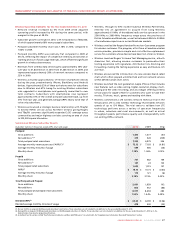
Operating Highlights and Significant Developments in 2010
• Generatedrevenuegrowthof5%atWirelessnetwork,4%atCable
Operations and 7% at Media, with consolidated annual revenue
growthof4%.Adjustedoperatingprotgrew6%to$4,653million
and adjusted operating profit margins expanded by 80 basis points
to38.2%.
• InFebruary2010,werenewedournormalcourseissuerbid(“NCIB”)
to repurchase up to the lesser of $1.5 billion or 43.6 million Class B
Non-Voting shares during the twelve-month period ending February
21, 2011, under which we purchased for cancellation 37.1 million
ClassB Non-Voting shares during 2010 for $1.3 billion.
• InFebruary2010,weincreasedtheannualizeddividendfrom$1.16
to $1.28 per Class A Voting and Class B Non-Voting share, paying out
$734 million in dividends to shareholders during the year.
• Weclosed$1.7billionaggregateprincipalamountofinvestment
grade debt offerings during the year, consisting of $800 million of
6.11%SeniorNotesdue2040and$900millionof4.70%SeniorNotes
due 2020. Among other things, proceeds of the offerings were used
to repay bank debt and redeem our public debt issues maturing in
2011. We redeemed all three of our public debt issues maturing in
2011,includingUS$490millionof9.625%SeniorNotes,$460million
of7.625%SeniorNotesand$175millionof7.25%SeniorNotes.In
total,wereducedourweightedaveragecostofborrowingto6.68%
atDecember31,2010from7.27%atDecember31,2009.
• We increased our ownership position in Cogeco Cable Inc. and
Cogeco Inc. for investment purposes, with the acquisition of
892,250 subordinate voting shares of Cogeco Cable Inc. and 946,090
subordinate voting shares of Cogeco Inc.
• Weincreasedfreecashow,denedasadjustedoperatingprot
less PP&E expenditures and interest on long-term debt, by 14%
from 2009 levels to $2.1 billion. Free cash flow per share increased
by23%reectingthegrowthinunderlyingfreecashowandthe
accretion from our share buybacks, which have decreased the base of
outstanding shares.
• AtDecember31,2010,therewerenoadvancesoutstandingunder
our $2.4 billion committed bank credit facility that matures in July
2013. This strong liquidity position is further enhanced by the fact
that our earliest scheduled debt maturity is in May 2012, together
providing us with substantial liquidity and flexibility.
• Subsequenttotheendof2010,onFebruary15,2011,weannounced
thatourBoardofDirectorshadapproved a11%increase inthe
annualized dividend to $1.42 per share effective immediately, and
that it has approved the renewal of our NCIB share buyback program
authorizing the repurchase of up to $1.5 billion of Rogers shares on
the open market during the next twelve months.
• Alsosubsequenttotheendoftheyear,onFebruary18,2011,we
announced that we have issued notices to redeem on March 21,2011
allofourUS$350millionprincipalamountof7.875%SeniorNotes
due2012andallofourUS$470millionprincipalamountof7.25%
Senior Notes due 2012, in each case at the applicable redemption
price plus accrued interest to the date of redemption, as prescribed
in the applicable indenture.
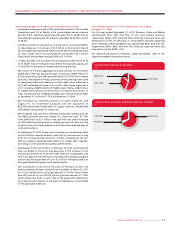
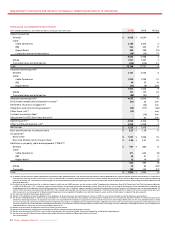
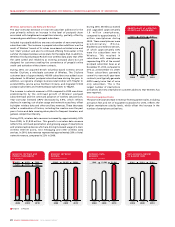
Year Ended December 31, 2010 Compared to Year Ended
December31,2009
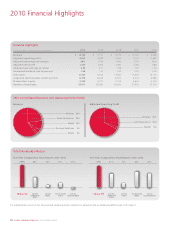
For the year ended December 31, 2010, Wireless, Cable and Media
represented 57%, 34% and 12% of our consolidated revenue,
respectively(2009–57%,34%and12%),offsetbycorporateitemsand
eliminationsof3%.Onthebasisofconsolidatedadjustedoperating
prot,Wireless,CableandMediaalsorepresented68%,31%and3%,
respectively(2009–69%,30%and3%),offsetbycorporateitemsand
eliminationsof2%(2009–2%).
For detailed discussions of Wireless, Cable and Media, refer to the
respective segment discussions below.
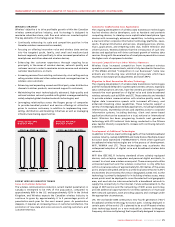
CONSOLIDATED ADJUSTED OPERATING PROFIT BY SEGMENT
(%)
Cable 30% Wireless 67%
Media 3%
CONSOLIDATED REVENUE BY SEGMENT
(%)
Media 12%
Wireless 56%
Cable 32%