Rogers 2010 Annual Report Download - page 79
Download and view the complete annual report
Please find page 79 of the 2010 Rogers annual report below. You can navigate through the pages in the report by either clicking on the pages listed below, or by using the keyword search tool below to find specific information within the annual report.-
 1
1 -
2
-
3
-
4
-
5
-
6
-
7
-
8
-
9
-
10
-
11
-
12
-
13
-
14
-
15
-
16
-
17
-
18
-
19
-
20
-
21
-
22
-
23
-
24
-
25
-
26
-
27
-
28
-
29
-
30
-
31
-
32
-
33
-
34
-
35
-
36
-
37
-
38
-
39
-
40
-
41
-
42
-
43
-
44
-
45
-
46
-
47
-
48
-
49
-
50
-
51
-
52
-
53
-
54
-
55
-
56
-
57
-
58
-
59
-
60
-
61
-
62
-
63
-
64
-
65
-
66
-
67
-
68
-
 69
69 -
 70
70 -
 71
71 -
 72
72 -
 73
73 -
 74
74 -
 75
75 -
 76
76 -
 77
77 -
 78
78 -
 79
79 -
 80
80 -
 81
81 -
 82
82 -
 83
83 -
 84
84 -
 85
85 -
 86
86 -
 87
87 -
 88
88 -
 89
89 -
90
-
91
-
92
-
93
-
94
-
95
-
96
-
97
-
98
-
99
-
100
-
101
-
102
-
103
-
104
-
105
-
106
-
107
-
108
-
109
-
110
-
111
-
112
-
113
-
114
-
115
-
116
-
117
-
118
-
119
-
120
 |
 |

ROGERS COMMUNICATIONS INC. 2010 ANNUAL REPORT 83
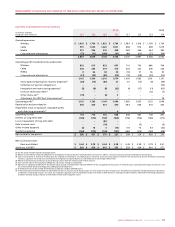
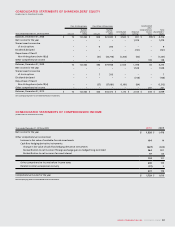
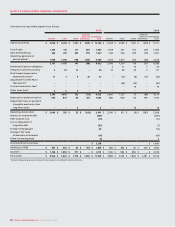
CONSOLIDATED STATEMENTS OF SHAREHOLDERS’ EQUITY
(IN MILLIONS OF CANADIAN DOLLARS)
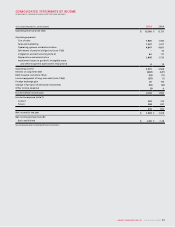
CONSOLIDATED STATEMENTS OF COMPREHENSIVE INCOME
(IN MILLIONS OF CANADIAN DOLLARS)
Class A Voting shares Class B Non-Voting shares
Contributed
surplus
Retained
earnings
Accumulated
other
comprehensive
income
(loss)
Total
shareholders’
equity
Years ended December 31, 2010 and 2009 Amount
Number
of shares
(000s) Amount
Number
of shares
(000s)
Balances, December 31, 2008 $ 72 112,462 $ 488 523,430 $ 3,560 $ 691 $ (95) $ 4,716
Net income for the year –––––1,478 –1,478
Shares issued on exercise
of stock options – – 9 294 – – – 9
Dividends declared –––––(721) –(721)
Repurchase of Class B
Non-Voting shares (note 18(c)) – – (41) (43,776) (1,256) (50) –(1,347)
Other comprehensive income ––––––138 138
Balances, December 31, 2009 72 112,462 456 479,948 2,304 1,398 43 4,273
Net income for the year –––––1,528 –1,528
Shares issued on exercise
of stock options – – 7 205 – – – 7
Dividends declared –––––(738) –(738)
Repurchase of Class B
Non-Voting shares (note 18(c)) – – (37) (37,081) (1,191) (84) –(1,312)
Other comprehensive income ––––––201 201
Balances, December 31, 2010 $ 72 112,4 62 $ 426 443,072 $ 1,113 $ 2,104 $ 244 $ 3,959
See accompanying notes to consolidated financial statements.
Years ended December 31, 2010 and 2009 2010 2009
Net income for the year $ 1,528 $ 1,478
Other comprehensive income (loss):
Increase in fair value of available-for-sale investments 104 14
Cash flow hedging derivative instruments:
Change in fair value of cash flow hedging derivative instruments (227) (844)
Reclassification to net income of foreign exchange gain on hedged long-term debt 264 901
Reclassification to net income of accrued interest 97 64
134 121
Other comprehensive income before income taxes 238 135
Related income tax (expense) recovery (37) 3
201 138
Comprehensive income for the year $ 1,729 $ 1,616
See accompanying notes to consolidated financial statements.