Rogers 2010 Annual Report Download - page 25
Download and view the complete annual report
Please find page 25 of the 2010 Rogers annual report below. You can navigate through the pages in the report by either clicking on the pages listed below, or by using the keyword search tool below to find specific information within the annual report.-
 1
1 -
2
-
3
-
4
-
5
-
6
-
7
-
8
-
9
-
10
-
11
-
12
-
13
-
14
-
 15
15 -
 16
16 -
 17
17 -
 18
18 -
 19
19 -
 20
20 -
 21
21 -
 22
22 -
 23
23 -
 24
24 -
 25
25 -
 26
26 -
 27
27 -
 28
28 -
 29
29 -
 30
30 -
 31
31 -
 32
32 -
 33
33 -
 34
34 -
 35
35 -
36
-
37
-
38
-
39
-
40
-
41
-
42
-
43
-
44
-
45
-
46
-
47
-
48
-
49
-
50
-
51
-
52
-
53
-
54
-
55
-
56
-
57
-
58
-
59
-
60
-
61
-
62
-
63
-
64
-
65
-
66
-
67
-
68
-
69
-
70
-
71
-
72
-
73
-
74
-
75
-
76
-
77
-
78
-
79
-
80
-
81
-
82
-
83
-
84
-
85
-
86
-
87
-
88
-
89
-
90
-
91
-
92
-
93
-
94
-
95
-
96
-
97
-
98
-
99
-
100
-
101
-
102
-
103
-
104
-
105
-
106
-
107
-
108
-
109
-
110
-
111
-
112
-
113
-
114
-
115
-
116
-
117
-
118
-
119
-
120
 |
 |
ROGERS COMMUNICATIONS INC. 2010 ANNUAL REPORT 29
MANAGEMENT’S DISCUSSION AND ANALYSIS OF FINANCIAL CONDITION AND RESULTS OF OPERATIONS
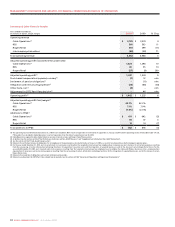
Wireless Operating Expenses
(1) See the section entitled “Stock-based Compensation”.
(2) Relates to the settlement of pension obligations for all employees in the pension plans who had retired as of January 1, 2009 as a result of annuity purchases by the Company’s pension plans.
(3) For the year ended December 31, 2010, costs incurred relate to i) severances resulting from the targeted restructuring of our employee base; ii) restructuring expenses resulting from the outsourcing of certain
information technology functions; and iii) the closure of certain Rogers Retail stores. For the year ended December 31, 2009, costs incurred relate to i) severances resulting from the targeted restructuring of
our employee base to combine the Cable and Wireless businesses into a communications organization; and ii) severances and restructuring expenses resulting from the outsourcing of certain information
technology functions.
(4) Relates to the resolution of obligations and accruals relating to prior periods.
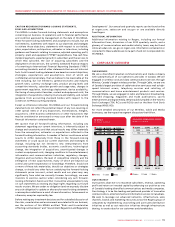
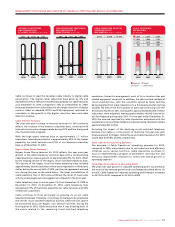
The $166 million increase in cost of equipment sales for 2010, compared
to 2009, was primarily the result of an increase in hardware upgrade
units versus the prior period and a continued increase in the mix of
smartphones for both new and upgrading subscribers. A large number
of existing iPhone and BlackBerry subscribers became eligible for
hardwareupgradesduringthesecondhalfof2010,whichledtoa57%
increase in the number of smartphone upgrades versus the year ended
December 31, 2009. This was the single largest factor driving the year-
over-year increase in expenses, and Wireless views these costs as net
present value positive investments in the acquisition and retention of
higher ARPU, lower churning customers who are on term contracts.
Sales and marketing expenses were flat for 2010, compared to 2009, as
increased spending on advertising and promotion costs for new
marketing campaigns, higher data activations, and higher dealer
compensation associated with both volumes and mix, were offset by
savings resulting from cost reduction initiatives.
The year-over-year increase in operating, general and administrative
expenses for 2010, compared to 2009, excluding retention spending
discussed below, was driven by the growth in the Wireless subscriber
base, offset by savings related to operating and scale efficiencies across
various functions. In addition, increases in information technology and
customer care as a result of the complexity of supporting more
sophisticated devices and services were predominately offset by savings
related to operating and scale efficiencies across various functions.
Total retention spending, including subsidies on handset upgrades,
was $815 million in 2010, compared to $588 million in 2009. The
significant increase is a result of a higher volume of upgrade activity
by existing subscribers as discussed above and a higher mix of
smartphones compared to 2009.
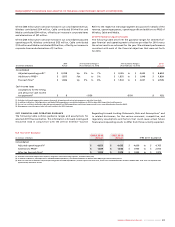
Years ended December 31,
(In millions of dollars) 2010 2009 %Chg
Operating expenses
Cost of equipment sales $ 1,225 $ 1,059 16
Sales and marketing expenses 628 630 –
Operating, general and administrative expenses 1,948 1,923 1
Operating expenses before the undernoted 3,801 3,612 5
Stock-based compensation expense(1) 11 – n/m
Settlement of pension obligations(2) – 3 n/m
Integration and restructuring expenses(3) 533 (85)
Other items, net(4) 5–n/m
Total operating expenses $ 3,822 $ 3,648 5
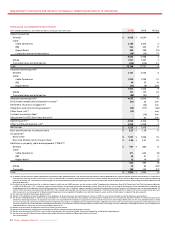
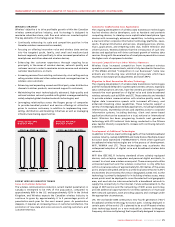
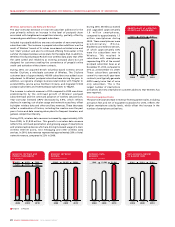
Wireless Adjusted Operating Profit
The4%year-over-yearincreaseinadjustedoperatingprotandthe
48.2%adjustedoperatingprotmarginonnetworkrevenue(which
excludes equipment sales revenue) for 2010 primarily reflect the
increase in the total operating expenses discussed above, driven heavily
by the record level of smartphone activations and upgrades and related
level of subsidy spending, partially offset by the increase in
network revenue.
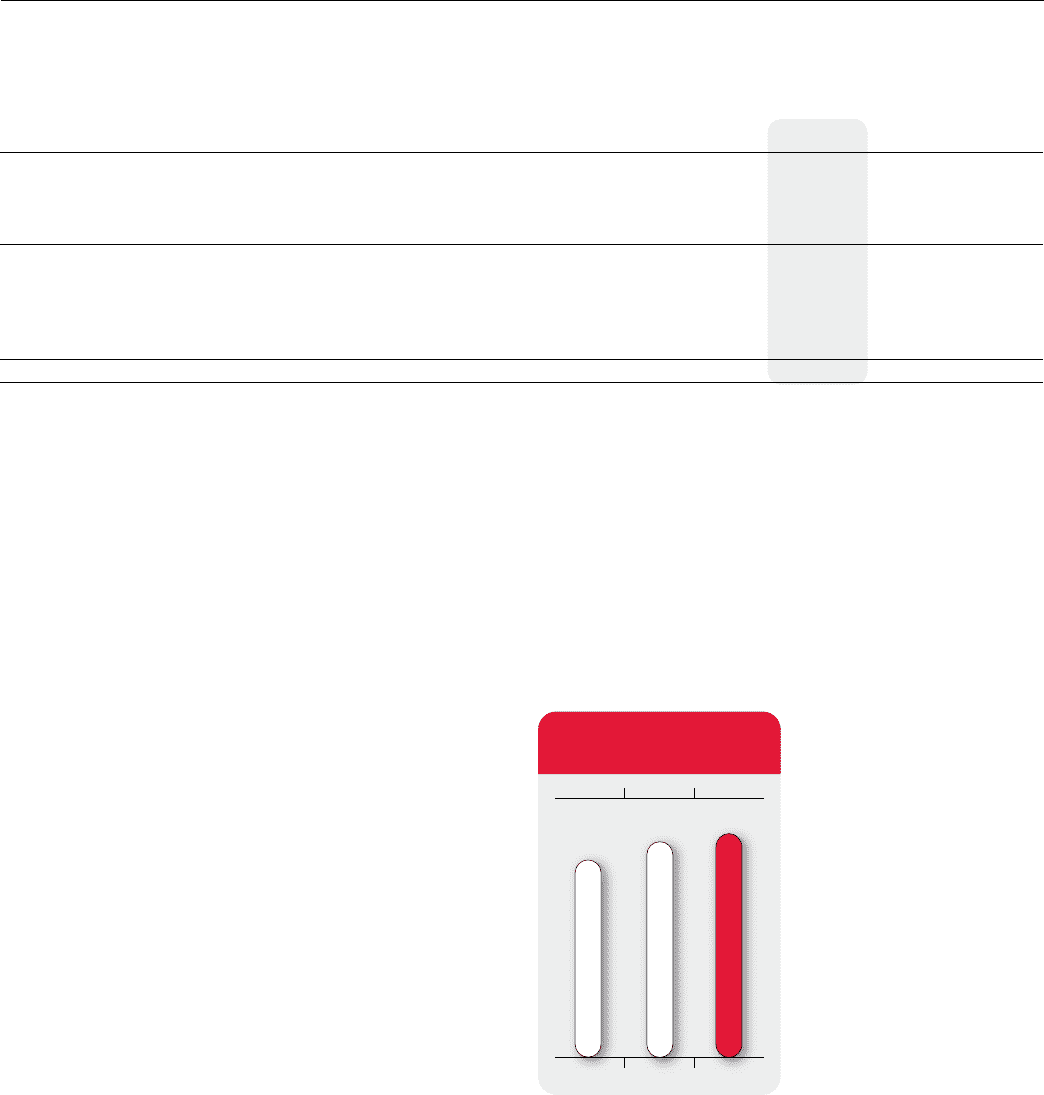
20102009
2008
2008
201
0
2009
$3,167$3,042$2,806
WIRELESS ADJUSTED
OPERATING PROFIT
(In millions of dollars)