Rogers 2010 Annual Report Download - page 80
Download and view the complete annual report
Please find page 80 of the 2010 Rogers annual report below. You can navigate through the pages in the report by either clicking on the pages listed below, or by using the keyword search tool below to find specific information within the annual report.-
 1
1 -
2
-
3
-
4
-
5
-
6
-
7
-
8
-
9
-
10
-
11
-
12
-
13
-
14
-
15
-
16
-
17
-
18
-
19
-
20
-
21
-
22
-
23
-
24
-
25
-
26
-
27
-
28
-
29
-
30
-
31
-
32
-
33
-
34
-
35
-
36
-
37
-
38
-
39
-
40
-
41
-
42
-
43
-
44
-
45
-
46
-
47
-
48
-
49
-
50
-
51
-
52
-
53
-
54
-
55
-
56
-
57
-
58
-
59
-
60
-
61
-
62
-
63
-
64
-
65
-
66
-
67
-
68
-
69
-
 70
70 -
 71
71 -
 72
72 -
 73
73 -
 74
74 -
 75
75 -
 76
76 -
 77
77 -
 78
78 -
 79
79 -
 80
80 -
 81
81 -
 82
82 -
 83
83 -
 84
84 -
 85
85 -
 86
86 -
 87
87 -
 88
88 -
 89
89 -
 90
90 -
91
-
92
-
93
-
94
-
95
-
96
-
97
-
98
-
99
-
100
-
101
-
102
-
103
-
104
-
105
-
106
-
107
-
108
-
109
-
110
-
111
-
112
-
113
-
114
-
115
-
116
-
117
-
118
-
119
-
120
 |
 |

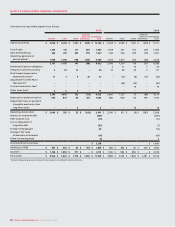
84 ROGERS COMMUNICATIONS INC. 2010 ANNUAL REPORT
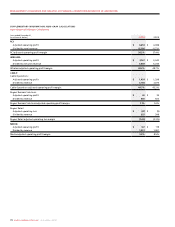
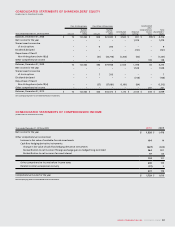
Years ended December 31, 2010 and 2009 2010 2009
Cash provided by (used in):
Operating activities:
Net income for the year $ 1,528 $ 1,478
Adjustments to reconcile net income to net cash flows from operating activities:
Depreciation and amortization 1,645 1,730
Impairment losses on goodwill, intangible assets and other long-term assets (notes 11(a) and 13) 618
Program rights and Rogers Retail rental amortization 221 174
Future income taxes 288 287
Unrealized foreign exchange gains (note 14(i)) (20) (126)
Loss on repayment of long-term debt 87 7
Change in fair value of derivative instruments 16 65
Settlement of pension obligations –30
Pension contributions, net of expense (30) (102)
Stock-based compensation expense (recovery) 47 (33)
Amortization of fair value increment on long-term debt (2) (5)
Other 14 3
3,800 3,526
Change in non-cash operating working capital items (note 20(a)) (180) 264
3,620 3,790
Investing activities:
Additions to property, plant and equipment (“PP&E”) (1,839) (1,855)
Change in non-cash working capital items related to PP&E 126 (55)
Acquisition of spectrum licences (47) (40)
Investment in Cogeco Inc. and Cogeco Cable Inc. (note 12) (75) (163)
Acquisitions, net of cash and cash equivalents acquired (201) (11)
Additions to program rights (170) (185)
Other 6(15)
(2,200) (2,324)
Financing activities:
Issuance of long-term debt 2,935 2,875
Repayment of long-term debt (2,387) (1,885)
Premium on repayment of long-term debt (79) (8)
Payment on settlement of cross-currency interest rate exchange agreements and forward contracts (816) (431)
Proceeds on settlement of cross-currency interest rate exchange agreements and forward contracts 547 433
Repurchase of Class B Non-Voting shares (1,312) (1,347)
Issuance of capital stock on exercise of stock options 33
Dividends paid (734) (704)
(1,843) (1,064)
Increase (decrease) in cash and cash equivalents (423) 402
Cash and cash equivalents (bank advances), beginning of year 383 (19)
Cash and cash equivalents (bank advances), end of year $ (40) $ 383
Cash and cash equivalents (bank advances) are defined as cash and short-term deposits, which have an original maturity of less than 90 days, less bank advances.
For supplemental cash flow information see note 20(b).
See accompanying notes to consolidated financial statements.
CONSOLIDATED STATEMENTS OF CASH FLOWS
(IN MILLIONS OF CANADIAN DOLLARS)