Rogers 2010 Annual Report Download - page 32
Download and view the complete annual report
Please find page 32 of the 2010 Rogers annual report below. You can navigate through the pages in the report by either clicking on the pages listed below, or by using the keyword search tool below to find specific information within the annual report.-
 1
1 -
2
-
3
-
4
-
5
-
6
-
7
-
8
-
9
-
10
-
11
-
12
-
13
-
14
-
15
-
16
-
17
-
18
-
19
-
20
-
21
-
 22
22 -
 23
23 -
 24
24 -
 25
25 -
 26
26 -
 27
27 -
 28
28 -
 29
29 -
 30
30 -
 31
31 -
 32
32 -
 33
33 -
 34
34 -
 35
35 -
 36
36 -
 37
37 -
 38
38 -
 39
39 -
 40
40 -
 41
41 -
 42
42 -
43
-
44
-
45
-
46
-
47
-
48
-
49
-
50
-
51
-
52
-
53
-
54
-
55
-
56
-
57
-
58
-
59
-
60
-
61
-
62
-
63
-
64
-
65
-
66
-
67
-
68
-
69
-
70
-
71
-
72
-
73
-
74
-
75
-
76
-
77
-
78
-
79
-
80
-
81
-
82
-
83
-
84
-
85
-
86
-
87
-
88
-
89
-
90
-
91
-
92
-
93
-
94
-
95
-
96
-
97
-
98
-
99
-
100
-
101
-
102
-
103
-
104
-
105
-
106
-
107
-
108
-
109
-
110
-
111
-
112
-
113
-
114
-
115
-
116
-
117
-
118
-
119
-
120
 |
 |

MANAGEMENT’S DISCUSSION AND ANALYSIS OF FINANCIAL CONDITION AND RESULTS OF OPERATIONS
36 ROGERS COMMUNICATIONS INC. 2010 ANNUAL REPORT
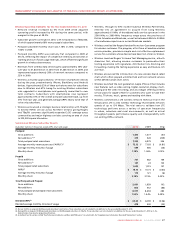
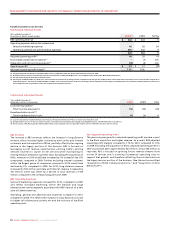
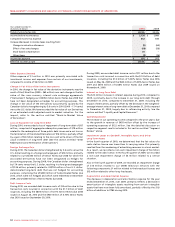
Summarized Subscriber Results
(1) On July 30, 2010, we acquired 6,000 television subscribers, 2,000 digital cable households, and 3,000 cable high-speed Internet subscribers from Kincardine. These subscribers are not included in net additions
for 2010.
(2) Cable high-speed Internet subscriber base excludes ADSL subscribers of 2,000 and 5,000 at December 31, 2010 and 2009, respectively. In addition, net additions exclude ADSL subscriber losses of 3,000 and
6,000 in the years ended December 31, 2010 and 2009, respectively.
(3) Includes approximately 8,000 and 17,000 migrations from circuit-switched to cable telephony for the years ended December 31, 2010 and 2009, respectively.
(4) Total cable service units are comprised of television subscribers, cable high-speed Internet subscribers and cable telephony lines.
(5) Approximately 30,000 circuit-switched lines were migrated during 2010 to a third party reseller under the terms of an agreement to sell the remaining circuit-switched telephone business. These migrations are
not included in net losses and migrations for 2010.
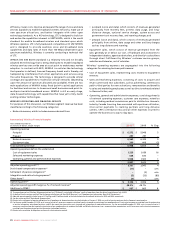
Cable Television Revenue
The increase in Cable Television revenue for 2010, compared to 2009,
reflects the continuing increase in penetration of our digital cable
product offerings and pricing changes. The slowdown in the year-over-
year growth rate of Cable Television revenue from 2009 to 2010 partially
reflects the timing of annual pricing changes, which took place in
March 2009 and July 2010, combined with the cumulative effect of
targeted bundling and retention initiatives to transition portions of the
subscriber base to term contracts and a lower number of subsidized
digital box sales.
Years ended December 31,
(Subscriber statistics in thousands) 2010 2009 Chg
Cable homes passed 3,708 3,635 73
Television
Net additions (losses) 4(24) 28
Total television subscribers(1) 2,305 2,296 9
Digital Cable
Households, net additions 67 114 (47)
Total digital cable households(1) 1,733 1,664 69
Cable High-speed Internet
Net additions(2) 64 48 16
Total cable high-speed Internet subscribers(1)(2) 1,686 1,619 67
Cable telephony lines
Net additions and migrations(3) 66 97 (31)
Total cable telephony lines 1,003 937 66
Total cable service units(4)
Net additions 134 121 13
Total cable service units 4,994 4,852 142
Circuit-switched lines
Net losses and migrations(3) (48) (91) 43
Total circuit-switched lines(5) 46 124 (78)
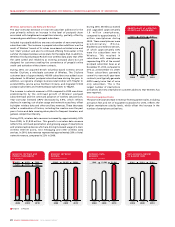
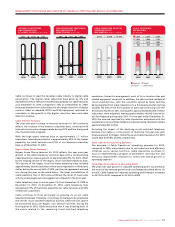
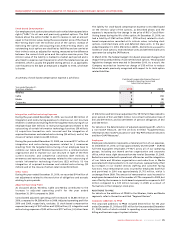
Home Phone 15%
Internet 25%
Television 34%
Digital 26%
CABLE SUBSCRIBER BREAKDOWN
20102009
2008
200
8
201
0
2009
1,733
75%
72%
67%
1,6641,550
DIGITAL HOUSEHOLDS
AND PENETRATION OF
TELEVISION CUSTOMERS
(In thousands)
20102009
2008
200
8
201
0
2009
850715568
HIGH-DEFINITION
HOUSEHOLDS
(In thousands)