Rogers 2010 Annual Report Download - page 67
Download and view the complete annual report
Please find page 67 of the 2010 Rogers annual report below. You can navigate through the pages in the report by either clicking on the pages listed below, or by using the keyword search tool below to find specific information within the annual report.-
 1
1 -
2
-
3
-
4
-
5
-
6
-
7
-
8
-
9
-
10
-
11
-
12
-
13
-
14
-
15
-
16
-
17
-
18
-
19
-
20
-
21
-
22
-
23
-
24
-
25
-
26
-
27
-
28
-
29
-
30
-
31
-
32
-
33
-
34
-
35
-
36
-
37
-
38
-
39
-
40
-
41
-
42
-
43
-
44
-
45
-
46
-
47
-
48
-
49
-
50
-
51
-
52
-
53
-
54
-
55
-
56
-
 57
57 -
 58
58 -
 59
59 -
 60
60 -
 61
61 -
 62
62 -
 63
63 -
 64
64 -
 65
65 -
 66
66 -
 67
67 -
 68
68 -
 69
69 -
 70
70 -
 71
71 -
 72
72 -
 73
73 -
 74
74 -
 75
75 -
 76
76 -
 77
77 -
78
-
79
-
80
-
81
-
82
-
83
-
84
-
85
-
86
-
87
-
88
-
89
-
90
-
91
-
92
-
93
-
94
-
95
-
96
-
97
-
98
-
99
-
100
-
101
-
102
-
103
-
104
-
105
-
106
-
107
-
108
-
109
-
110
-
111
-
112
-
113
-
114
-
115
-
116
-
117
-
118
-
119
-
120
 |
 |

ROGERS COMMUNICATIONS INC. 2010 ANNUAL REPORT 71
MANAGEMENT’S DISCUSSION AND ANALYSIS OF FINANCIAL CONDITION AND RESULTS OF OPERATIONS
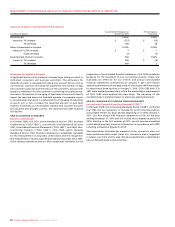
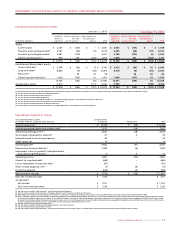
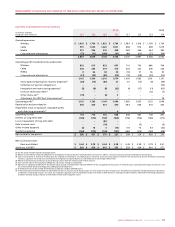
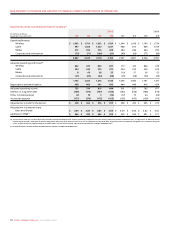
Condensed consolidated balance sheets:
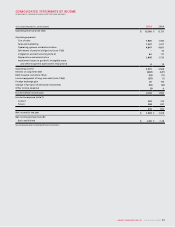
Consolidated statement of income:
(1) See the sections entitled “Joint Ventures” and “Customer Loyalty Programs”.
(2) See the sections entitled “Joint Ventures”, “Employee Benefits” and “Provisions for Onerous Contracts”.
(3) Operating profit should not be considered as a substitute or alternative for operating income or net income, in each case determined in accordance with both Canadian GAAP and IFRS.
(4) The ‘as adjusted’ amounts presented above are reviewed regularly by management and our Board of Directors in assessing our performance and in making decisions regarding the ongoing operations of the
business and the ability to generate cash flows. The ‘as adjusted’ amounts exclude (i) stock-based compensation expense (recovery); (ii) integration and restructuring expenses; (iii) other items (net); and (iv)
in respect of net income and net income per share, debt issuance costs, loss on the repayment of long-term debt, impairment losses on goodwill, intangible assets and other long-term assets, and the related
income tax impact of the above amounts, and for IFRS only, amortization of deferred transaction costs.
(5) See the section entitled “Share-Based Payments”.
(6) See the sections entitled “Fixed Asset: Componentization” and “Joint Ventures”.
(7) See the section entitled “Impairment of Assets”.
(8) See the sections entitled “Joint Ventures” and “Financial Instruments: Transactions Costs”. The adjustments also include reclassification related to income from associates.
(1) Reclassification includes change from proportionate consolidation to equity method for joint ventures as well as other presentation changes which do not impact shareholders’ equity.
(2) See the section entitled “Fixed Assets: Componentization”.
(3) See the section entitled “Impairment of Assets”.
(4) See the section entitled “Employee Benefits”.
(5) See the sections entitled “Share-Based Payments”, “Customer Loyalty Programs” and “Provisions for Onerous Contracts”.
(6) See the section entitled “Financial Instruments: Transaction Costs”.
(7) See the section entitled “Provisions for Onerous Contracts”.
(8) See the sections entitled “Share-Based Payments”, “Employee Benefits”, “Joint Ventures” and “Other impacts”.
January 1, 2010 December 31, 2010
(In millions of dollars)
Canadian
GAAP, as
reported
Reclassification
for IFRS
presentation(1)
Adjustments to
shareholders’
equity IFRS
Canadian
GAAP, as
reported
Reclassification
for IFRS
presentation(1)
Adjustments to
shareholders’
equity IFRS
Assets
Current assets $ 2,255 $ (230) $ – $ 2,025 $ 2,005 $ (147) $ – $ 1,858
Property, plant and equipment(2) 8,197 (50) (11) 8 ,136 8,493 (46) (10) 8,437
Goodwill and intangible assets(3) 5,661 (110) – 5,551 5,784 (157) (5) 5,622
Other long-term assets(4) 905 228 (120) 1,013 1,048 201 (138) 1,111
$ 17,018 $ (162) $ (131) $ 16,725 $ 17,330 $ (149) $ (153) $ 17,028
Liabilities and Shareholders’ equity
Current liabilities(5) $ 2,748 $ (59) $ 15 $ 2,704 $ 3,013 $ (69) $ 22 $ 2,966
Long-term debt(6) 8,463 (9) (58) 8,396 8,718 (9) (55) 8,654
Provisions(7) – 39 19 58 – 36 26 62
Other long-term liabilities(8) 1,534 (133) 10 1,411 1,640 (107) 53 1,586
12,745 (162) (14) 12,569 13,371 (149) 46 13,268
Shareholders’ equity 4,273 – (117) 4,156 3,959 – (199) 3,760
$ 17,018 $ (162) $ (131) $ 16,725 $ 17,330 $ (149) $ (153) $ 17,028
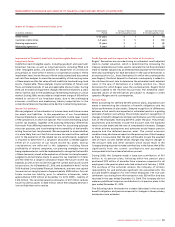
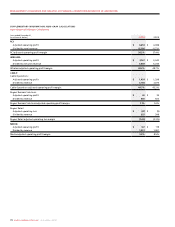
Year ended December 31,2010
(In millions of dollars, except per share amounts)
Canadian GAAP,
as reported Adjustments IFRS
Operating revenue(1) $ 12,186 $ (44) $ 12,142
Operating expenses before the undernoted(2) 7,533 (26) 7,507
Adjusted operating profit(3)(4) 4,653 (18) 4,635
Stock-based compensation expense(5) 47 350
Integration and restructuring expenses 40 – 40
Other items, net 14 – 14
Operating profit(3) 4,552 (21) 4,531
Depreciation and amortization(6) 1,645 (6) 1,639
Impairment losses on goodwill, intangible assets
and other long-term assets(7) 6 5 11
Operating income 2,901 (20) 2,881
Interest on long-term debt (669) –(669)
Loss on repayment of long-term debt (87) –(87)
Other income (expense), net(8) (7) (4) (11)
Income tax expense (610) (2) (612)
Net income for the year $ 1,528 $ (26) $ 1,502
Basic net income per share $ 2.65 $ 2.61
As adjusted:(4)
Net income $ 1,707 $ 1,703
Basic net income per share $ 2.96 $ 2.96