Rogers 2010 Annual Report Download - page 107
Download and view the complete annual report
Please find page 107 of the 2010 Rogers annual report below. You can navigate through the pages in the report by either clicking on the pages listed below, or by using the keyword search tool below to find specific information within the annual report.-
 1
1 -
2
-
3
-
4
-
5
-
6
-
7
-
8
-
9
-
10
-
11
-
12
-
13
-
14
-
15
-
16
-
17
-
18
-
19
-
20
-
21
-
22
-
23
-
24
-
25
-
26
-
27
-
28
-
29
-
30
-
31
-
32
-
33
-
34
-
35
-
36
-
37
-
38
-
39
-
40
-
41
-
42
-
43
-
44
-
45
-
46
-
47
-
48
-
49
-
50
-
51
-
52
-
53
-
54
-
55
-
56
-
57
-
58
-
59
-
60
-
61
-
62
-
63
-
64
-
65
-
66
-
67
-
68
-
69
-
70
-
71
-
72
-
73
-
74
-
75
-
76
-
77
-
78
-
79
-
80
-
81
-
82
-
83
-
84
-
85
-
86
-
87
-
88
-
89
-
90
-
91
-
92
-
93
-
94
-
95
-
96
-
 97
97 -
 98
98 -
 99
99 -
 100
100 -
 101
101 -
 102
102 -
 103
103 -
 104
104 -
 105
105 -
 106
106 -
 107
107 -
 108
108 -
 109
109 -
 110
110 -
 111
111 -
 112
112 -
 113
113 -
 114
114 -
 115
115 -
 116
116 -
 117
117 -
118
-
119
-
120
 |
 |

NOTES TO CONSOLIDATED FINANCIAL STATEMENTS
ROGERS COMMUNICATIONS INC. 2010 ANNUAL REPORT 111
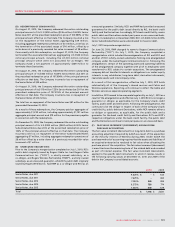
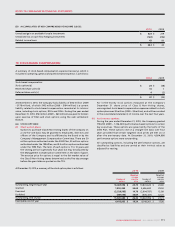
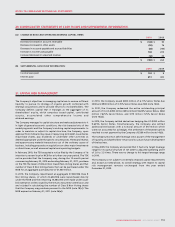
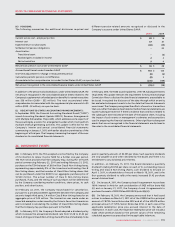
(D) ACCUMULATED OTHER COMPREHENSIVE INCOME (LOSS):
2010 2009
Unrealized gain on available-for-sale investments $ 323 $ 219
Unrealized loss on cash flow hedging instruments (122) (256)
Related income taxes 43 80
$ 244 $ 43
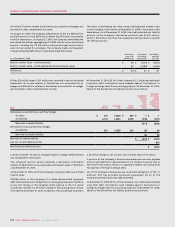
At December 31, 2010, the Company had a liability of $162 million (2009
– $178 million), of which $142 million (2009 – $164 million) is a current
liability related to stock-based compensation recorded at its intrinsic
value, including stock options, RSUs and DSUs. During the year ended
December 31, 2010, $58 million (2009 – $63 million) was paid to holders
upon exercise of RSUs and stock options using the cash settlement
feature.
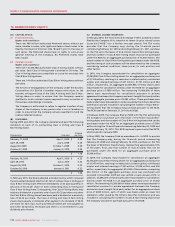
(A) STOCK OPTIONS:
(i) Stock option plans:
Options to purchase Class B Non-Voting shares of the Company on
a one-for-one basis may be granted to employees, directors and
officers of the Company and its affiliates by the Board or by the
Company’s Management Compensation Committee. There are 30
million options authorized under the 2000 Plan, 25 million options
authorized under the 1996 Plan, and 9.5 million options authorized
under the 1994 Plan. The term of each option is 7 to 10 years and
the vesting period is generally four years but may be adjusted by
the Management Compensation Committee on the date of grant.
The exercise price for options is equal to the fair market value of
the Class B Non-Voting shares determined as the five-day average
before the grant date as quoted on the TSX.
For in-the-money stock options measured at the Company’s
December 31 share price of Class B Non-Voting shares,
unrecognized stock-based compensation expense related to stock
option plans was $3 million (2009 – $5 million), and will be recorded
in the consolidated statements of income over the next four years.
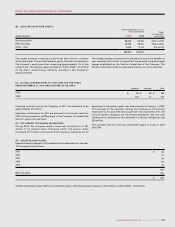
(ii) Performance options:
During the year ended December 31, 2010, the Company granted
759,200 (2009 – 1,156,200) performance-based options to certain
key executives. These options are governed by the terms of the
2000 Plan. These options vest on a straight-line basis over four
years provided that certain targeted stock prices are met on or
after the anniversary date. At December 31, 2010, 4,894,980
performance options were outstanding.
All outstanding options, including the performance options, are
classified as liabilities and are carried at their intrinsic value as
adjusted for vesting.
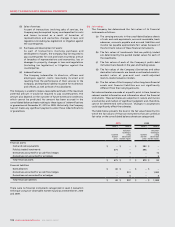
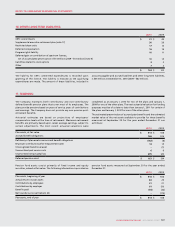
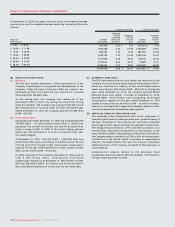
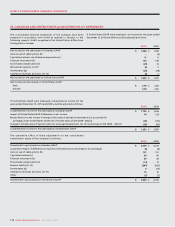
19. STOCK-BASED COMPENSATION:
A summary of stock-based compensation expense (recovery), which is
included in operating, general and administrative expense, is as follows:
2010 2009
Stock-based compensation:
Stock options (a) $ 24 $ (38)
Restricted share units (b) 19 7
Deferred share units (c) 4(2)
$ 47 $ (33)
At December 31, 2010, a summary of the stock option plans is as follows:
2010 2009
Number of
options
Weighted
average
exercise
price
Number of
options
Weighted
average
exercise
price
Outstanding, beginning of year 13,467,096 $ 23.73 13,841,620 $ 20.80
Granted 1,350,225 34.69 2,636,600 29.50
Exercised (2,528,585) 14.78 (2,604,787) 12.88
Forfeited (4 47,056) 34.89 (406,337) 32.20
Outstanding, end of year 11,841,680 $ 26.42 13,467,096 $ 23.73
Exercisable, end of year 6,415,933 $ 19.24 8,149,361 $ 17.56