Rogers 2010 Annual Report Download - page 72
Download and view the complete annual report
Please find page 72 of the 2010 Rogers annual report below. You can navigate through the pages in the report by either clicking on the pages listed below, or by using the keyword search tool below to find specific information within the annual report.-
 1
1 -
2
-
3
-
4
-
5
-
6
-
7
-
8
-
9
-
10
-
11
-
12
-
13
-
14
-
15
-
16
-
17
-
18
-
19
-
20
-
21
-
22
-
23
-
24
-
25
-
26
-
27
-
28
-
29
-
30
-
31
-
32
-
33
-
34
-
35
-
36
-
37
-
38
-
39
-
40
-
41
-
42
-
43
-
44
-
45
-
46
-
47
-
48
-
49
-
50
-
51
-
52
-
53
-
54
-
55
-
56
-
57
-
58
-
59
-
60
-
61
-
 62
62 -
 63
63 -
 64
64 -
 65
65 -
 66
66 -
 67
67 -
 68
68 -
 69
69 -
 70
70 -
 71
71 -
 72
72 -
 73
73 -
 74
74 -
 75
75 -
 76
76 -
 77
77 -
 78
78 -
 79
79 -
 80
80 -
 81
81 -
 82
82 -
83
-
84
-
85
-
86
-
87
-
88
-
89
-
90
-
91
-
92
-
93
-
94
-
95
-
96
-
97
-
98
-
99
-
100
-
101
-
102
-
103
-
104
-
105
-
106
-
107
-
108
-
109
-
110
-
111
-
112
-
113
-
114
-
115
-
116
-
117
-
118
-
119
-
120
 |
 |

MANAGEMENT’S DISCUSSION AND ANALYSIS OF FINANCIAL CONDITION AND RESULTS OF OPERATIONS
76 ROGERS COMMUNICATIONS INC. 2010 ANNUAL REPORT
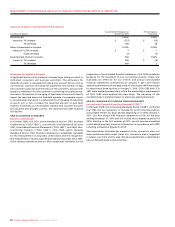
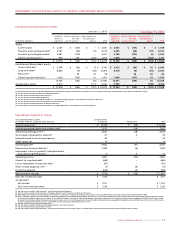
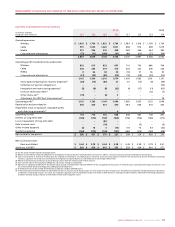
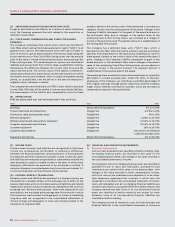
(1) This quarterly summary has been adjusted to exclude stock-based compensation expense (recovery), integration and restructuring expenses, contract termination fees, an adjustment to CRTC Part II fees
related to prior periods, settlement of pension obligations, other items (net), debt issuance costs, loss on repayment of long-term debt, impairment losses on goodwill, intangible assets and other long-term
assets, and the income tax impact related to the above items. See the section entitled “Key Performance Indicators and Non-GAAP Measures”.
(2) As defined. See the section entitled “Key Performance Indicators and Non-GAAP Measures”.
Adjusted Quarterly Consolidated Financial Summary(1)
2010 2009
(In millions of dollars,
except per share amounts) Q1 Q2 Q3 Q4 Q1 Q2 Q3 Q4
Operating Revenue
Wireless $ 1,662 $ 1,700 $ 1,822 $ 1,784 $ 1,544 $ 1,616 $ 1,760 $ 1,734
Cable 997 1,004 1,020 1,031 968 972 989 1,019
Media 301 396 376 428 284 366 364 393
Corporate and eliminations (73) (71) (100) (91) (49) (63) (77) (89)
2,887 3,029 3,118 3,152 2,747 2,891 3,036 3,057
Adjusted operating profit (loss)(2)
Wireless 832 815 823 697 710 742 846 744
Cable 344 344 379 370 324 332 329 325
Media 8 66 38 35 (10) 37 36 52
Corporate and eliminations (21) (25) (24) (28) (19) (28) (30) (20)
1,163 1,200 1,216 1,074 1,005 1,083 1,181 1,101
Depreciation and amortization 408 406 401 430 444 446 416 424
Adjusted operating income 755 794 815 644 561 637 765 677
Interest on long-term debt (168) (170) (167) (164) (152) (156) (166) (173)
Other income (expense) (2) 18 3 (16) (17) 73 44 (23)
Income tax expense (177) (178) (175) (105) (136) (142) (138) (111)
Adjusted net income for the period $ 408 $ 464 $ 476 $ 359 $ 256 $ 412 $ 505 $ 370
Adjusted net income per share:
Basic and diluted $ 0.69 $ 0.80 $ 0.83 $ 0.64 $ 0.40 $ 0.65 $ 0.82 $ 0.61
Additions to PP&E(2) $ 366 $ 439 $ 442 $ 592 $ 359 $ 434 $ 491 $ 571