Rogers 2010 Annual Report Download - page 71
Download and view the complete annual report
Please find page 71 of the 2010 Rogers annual report below. You can navigate through the pages in the report by either clicking on the pages listed below, or by using the keyword search tool below to find specific information within the annual report.-
 1
1 -
2
-
3
-
4
-
5
-
6
-
7
-
8
-
9
-
10
-
11
-
12
-
13
-
14
-
15
-
16
-
17
-
18
-
19
-
20
-
21
-
22
-
23
-
24
-
25
-
26
-
27
-
28
-
29
-
30
-
31
-
32
-
33
-
34
-
35
-
36
-
37
-
38
-
39
-
40
-
41
-
42
-
43
-
44
-
45
-
46
-
47
-
48
-
49
-
50
-
51
-
52
-
53
-
54
-
55
-
56
-
57
-
58
-
59
-
60
-
 61
61 -
 62
62 -
 63
63 -
 64
64 -
 65
65 -
 66
66 -
 67
67 -
 68
68 -
 69
69 -
 70
70 -
 71
71 -
 72
72 -
 73
73 -
 74
74 -
 75
75 -
 76
76 -
 77
77 -
 78
78 -
 79
79 -
 80
80 -
 81
81 -
82
-
83
-
84
-
85
-
86
-
87
-
88
-
89
-
90
-
91
-
92
-
93
-
94
-
95
-
96
-
97
-
98
-
99
-
100
-
101
-
102
-
103
-
104
-
105
-
106
-
107
-
108
-
109
-
110
-
111
-
112
-
113
-
114
-
115
-
116
-
117
-
118
-
119
-
120
 |
 |

ROGERS COMMUNICATIONS INC. 2010 ANNUAL REPORT 75
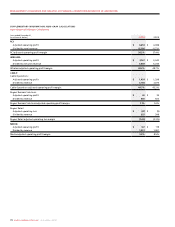
MANAGEMENT’S DISCUSSION AND ANALYSIS OF FINANCIAL CONDITION AND RESULTS OF OPERATIONS
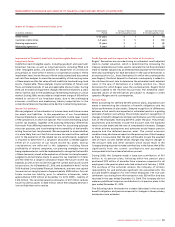
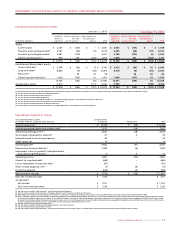
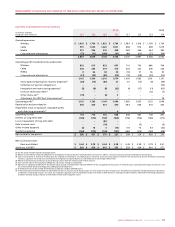
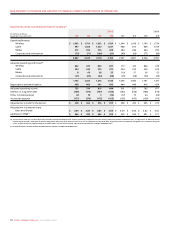
Quarterly Consolidated Financial Summary
(1) See the section entitled “Stock-based Compensation”.
(2) Relates to the settlement of pension obligations for all employees in the pension plans who had retired as of January 1, 2009 as a result of annuity purchases by the Company’s pension plans.
(3) Costs incurred relate to severances resulting from the targeted restructuring of our employee base, severances and restructuring expenses related to the outsourcing of certain information technology
functions, acquisition transaction costs incurred and the integration of acquired businesses, and the closure of certain Rogers Retail stores.
(4) Relates to the termination and release of certain Blue Jays players from the remaining term of their contracts.
(5) Costs incurred relate to the resolution of obligations and accruals relating to prior periods.
(6) Related to an adjustment of CRTC Part II fees related to prior periods. The adjustments related to CRTC Part II fees are applicable to the quarters in which they occur and only partially impact the full years. See
the section entitled “Government Regulation and Regulatory Developments”.
(7) As defined. See the section entitled “Key Performance Indicators and Non-GAAP Measures”.
(8) In the fourth quarter of 2010 and 2009, we determined that the fair values of certain broadcasting assets were lower than their carrying values. This primarily resulted from weakening industry expectations
and declines in advertising revenues. As a result, we recorded an aggregate non-cash impairment charge of $6 million in 2010 related to a radio licence and $18 million in 2009 with the following components:
$5 million related to broadcast licences and $13 million related to other long-term assets.
2010 2009
(In millions of dollars,
except per share amounts) Q1 Q2 Q3 Q4 Q1 Q2 Q3 Q4
Operating revenue
Wireless $ 1,662 $ 1,700 $ 1,822 $ 1,784 $ 1,544 $ 1,616 $ 1,760 $ 1,734
Cable 997 1,004 1,020 1,031 968 972 989 1,019
Media 301 396 376 428 284 366 364 393
Corporate and eliminations (73) (71) (100) (91) (49) (63) (77) (89)
2,887 3,029 3,118 3,152 2,747 2,891 3,036 3,057
Operating profit (loss) before the undernoted
Wireless 832 815 823 697 710 742 846 744
Cable 344 344 379 370 324 332 329 325
Media 8 66 38 35 (10) 37 36 52
Corporate and eliminations (21) (25) (24) (28) (19) (28) (30) (20)
1,163 1,200 1,216 1,074 1,005 1,083 1,181 1,101
Stock-based compensation recovery (expense)(1) (24) (10) (40) 27 81 (13) (6) (29)
Settlement of pension obligations(2) – – – – – – – (30)
Integration and restructuring expenses(3) (2) (8) (8) (22) (4) (37) (11) (65)
Contract termination fees(4) – – – – – – (12) (7)
Other items, net(5) (15) –(4) 5––––
Adjustment for CRTC Part II fees decision(6) – – – – – – – 79
Operating profit(7) 1,122 1,182 1,164 1,084 1,082 1,033 1,152 1,049
Depreciation and amortization 408 406 401 430 444 446 416 424
Impairment losses on goodwill, intangible assets
and other long-term assets(8) – – – 6 – – – 18
Operating income 714 776 763 648 638 587 736 607
Interest on long-term debt (168) (170) (167) (164) (152) (156) (166) (173)
Loss on repayment of long-term debt – – (87) –––––
Debt issuance costs – – (10) – – (5) – (6)
Other income (expense) (2) 18 3 (16) (17) 73 44 (30)
Income tax expense (164) (173) (132) (141) (160) (125) (129) (88)
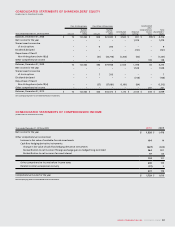
Net income for the period $ 380 $ 451 $ 370 $ 327 $ 309 $ 374 $ 485 $ 310
Net income per share:
Basic and diluted $ 0.64 $ 0.78 $ 0.64 $ 0.58 $ 0.49 $ 0.59 $ 0.79 $ 0.51
Additions to PP&E(7) $ 366 $ 439 $ 442 $ 592 $ 359 $ 434 $ 491 $ 571