Rogers 2010 Annual Report Download - page 39
Download and view the complete annual report
Please find page 39 of the 2010 Rogers annual report below. You can navigate through the pages in the report by either clicking on the pages listed below, or by using the keyword search tool below to find specific information within the annual report.-
 1
1 -
2
-
3
-
4
-
5
-
6
-
7
-
8
-
9
-
10
-
11
-
12
-
13
-
14
-
15
-
16
-
17
-
18
-
19
-
20
-
21
-
22
-
23
-
24
-
25
-
26
-
27
-
28
-
 29
29 -
 30
30 -
 31
31 -
 32
32 -
 33
33 -
 34
34 -
 35
35 -
 36
36 -
 37
37 -
 38
38 -
 39
39 -
 40
40 -
 41
41 -
 42
42 -
 43
43 -
 44
44 -
 45
45 -
 46
46 -
 47
47 -
 48
48 -
 49
49 -
50
-
51
-
52
-
53
-
54
-
55
-
56
-
57
-
58
-
59
-
60
-
61
-
62
-
63
-
64
-
65
-
66
-
67
-
68
-
69
-
70
-
71
-
72
-
73
-
74
-
75
-
76
-
77
-
78
-
79
-
80
-
81
-
82
-
83
-
84
-
85
-
86
-
87
-
88
-
89
-
90
-
91
-
92
-
93
-
94
-
95
-
96
-
97
-
98
-
99
-
100
-
101
-
102
-
103
-
104
-
105
-
106
-
107
-
108
-
109
-
110
-
111
-
112
-
113
-
114
-
115
-
116
-
117
-
118
-
119
-
120
 |
 |
ROGERS COMMUNICATIONS INC. 2010 ANNUAL REPORT 43
MANAGEMENT’S DISCUSSION AND ANALYSIS OF FINANCIAL CONDITION AND RESULTS OF OPERATIONS
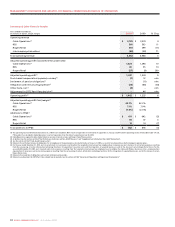
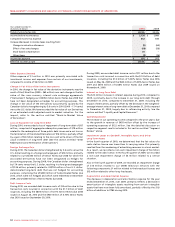
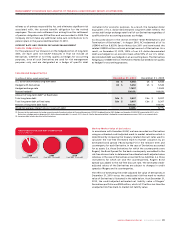
RECONCILIATION OF NET INCOME TO OPERATING
PROFIT AND ADJUSTED OPERATING PROFIT FOR
THE PERIOD
The items listed below represent the consolidated income and expense
amounts that are required to reconcile net income as defined under
Canadian GAAP to the non-GAAP measures operating profit and
adjusted operating profit for the year. See the section entitled
“Supplementary Information: Non-GAAP Calculations” for a full
reconciliation to adjusted operating profit, adjusted net income and
adjusted net income per share. For details of these amounts on a
segment-by-segment basis and for an understanding of intersegment
eliminations on consolidation, the following section should be read in
conjunction with Note 3 to the 2010 Audited Consolidated Financial
Statements entitled “Segmented Information”.
Years ended December 31,
(In millions of dollars) 2010 2009 %Chg
Net income $ 1,528 $ 1,478 3
Income tax expense 610 502 22
Other expense (income) 1(6) n/m
Change in the fair value of derivative instruments 16 65 (75)
Loss on repayment of long-term debt 87 7 n/m
Foreign exchange gain (20) (136) (85)
Debt issuance costs 10 11 (9)
Interest on long-term debt 669 647 3
Operating income 2,901 2,568 13
Impairment losses on goodwill, intangible assets and
other long-term assets 6 18 (67)
Depreciation and amortization 1,645 1,730 (5)
Operating profit 4,552 4,316 5
Stock-based compensation expense (recovery) 47 (33) n/m
Settlement of pension obligations – 30 n/m
Integration and restructuring expenses 40 117 (66)
Other items, net 14 – n/m
Contract termination fees –19 n/m
Adjustment for CRTC Part II fees decision –(61) n/m
Adjusted operating profit $ 4,653 $ 4,388 6
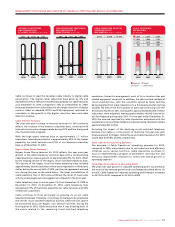
Net Income
The $50 million increase in net
income compared to the prior
year is primarily due to the growth
in operating income of $333
million, offset mainly by a
decrease in foreign exchange
gains of $116 million, an increase
in loss on repayment of long-term
debt of $80 million, and a $108
million increase in income tax
expense.
Income Tax Expense
Our effective income tax rate for
the years ended December 31,
2010 and 2009 was 28.5% and
25.4%, respectively. The 2010
effective income tax rate was less
than the 2010 statutory income
taxrateof30.5%primarilyduetoanincometaxrecoveryof$69million
resulting from the effect of tax rate changes, which was partially offset
by an income tax charge of $35 million to reduce future tax assets
previously recognized relating to stock options (see the section entitled
“Stock-based Compensation”). For the year ended December 31, 2010,
our income taxes paid were $152 million.
The 2009 effective income tax rate was less than the 2009 statutory
incometaxrateof32.3%primarilyduetoanincometaxrecoveryof
$58 million resulting from reductions in substantively enacted tax rates
and the $64 million release of our valuation allowance. The release of
our valuation allowance includes $14 million relating to a decrease of
future tax assets in foreign jurisdictions arising from foreign exchange
rate fluctuations and $50 million relating to unrealized gains on
investments and financial instruments. For the year ended December
31, 2009, our income taxes paid were $8 million.
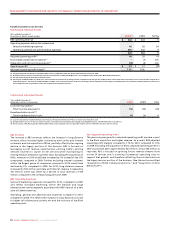
Income tax expense varies from the amounts that would be computed
by applying the statutory income tax rate to income before income
taxes for the following reasons:
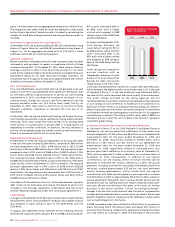
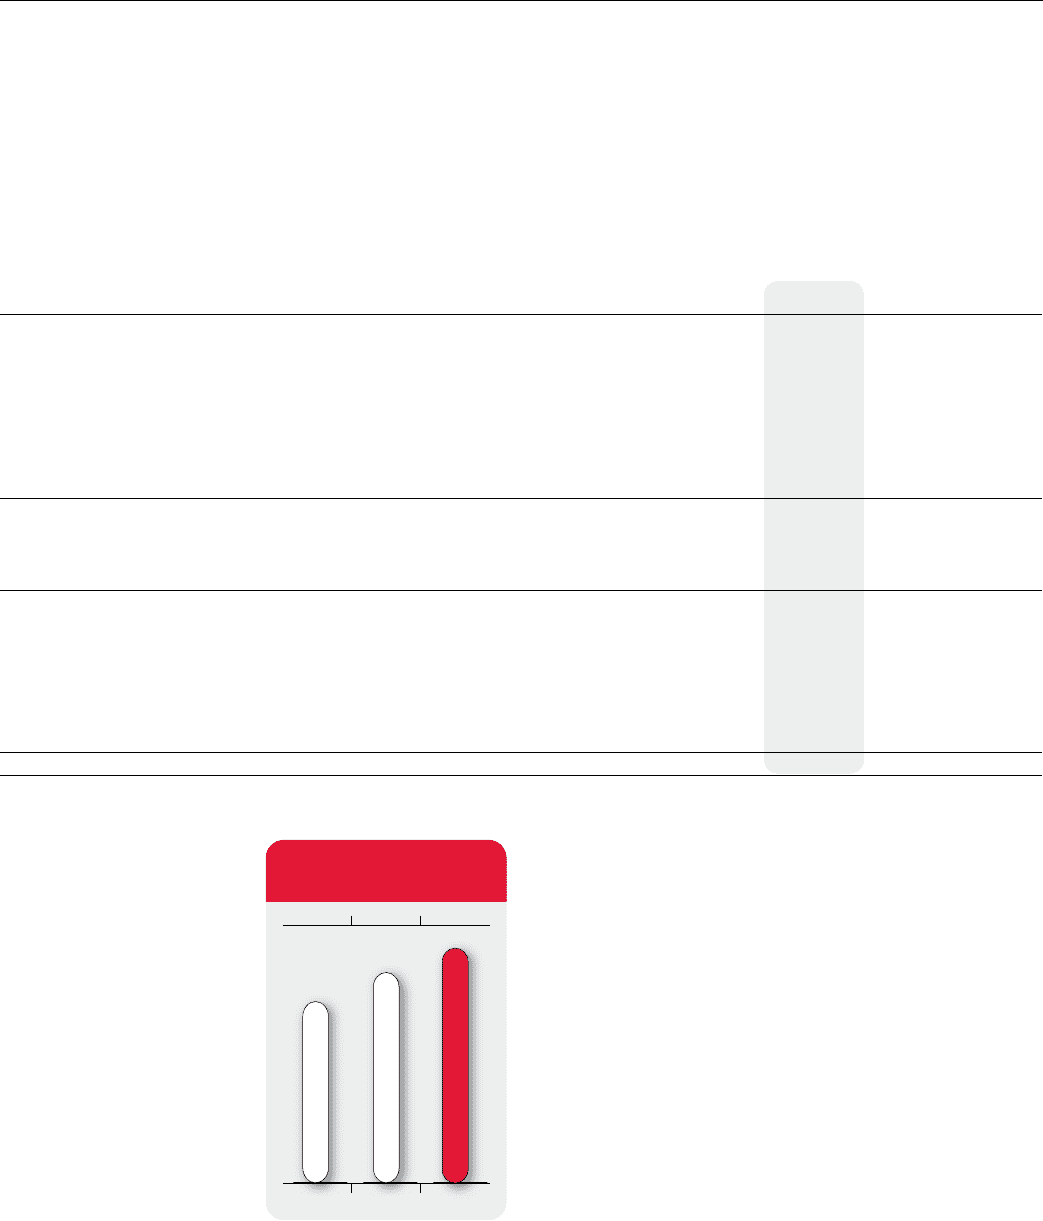
20102009
2008
2009
200
8
201
0
$1,556$1,260 $1,707
CONSOLIDATED ADJUSTED
NET INCOME
(In millions of dollars)