Rogers 2010 Annual Report Download - page 102
Download and view the complete annual report
Please find page 102 of the 2010 Rogers annual report below. You can navigate through the pages in the report by either clicking on the pages listed below, or by using the keyword search tool below to find specific information within the annual report.-
 1
1 -
2
-
3
-
4
-
5
-
6
-
7
-
8
-
9
-
10
-
11
-
12
-
13
-
14
-
15
-
16
-
17
-
18
-
19
-
20
-
21
-
22
-
23
-
24
-
25
-
26
-
27
-
28
-
29
-
30
-
31
-
32
-
33
-
34
-
35
-
36
-
37
-
38
-
39
-
40
-
41
-
42
-
43
-
44
-
45
-
46
-
47
-
48
-
49
-
50
-
51
-
52
-
53
-
54
-
55
-
56
-
57
-
58
-
59
-
60
-
61
-
62
-
63
-
64
-
65
-
66
-
67
-
68
-
69
-
70
-
71
-
72
-
73
-
74
-
75
-
76
-
77
-
78
-
79
-
80
-
81
-
82
-
83
-
84
-
85
-
86
-
87
-
88
-
89
-
90
-
91
-
 92
92 -
 93
93 -
 94
94 -
 95
95 -
 96
96 -
 97
97 -
 98
98 -
 99
99 -
 100
100 -
 101
101 -
 102
102 -
 103
103 -
 104
104 -
 105
105 -
 106
106 -
 107
107 -
 108
108 -
 109
109 -
 110
110 -
 111
111 -
 112
112 -
113
-
114
-
115
-
116
-
117
-
118
-
119
-
120
 |
 |

NOTES TO CONSOLIDATED FINANCIAL STATEMENTS
106 ROGERS COMMUNICATIONS INC. 2010 ANNUAL REPORT
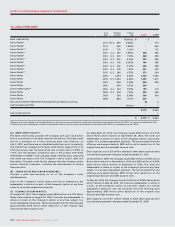
2010 2009
Level 1 Level 2 Level 1 Level 2
Quoted
market
price
Valuation
technique
using
observable
market inputs
Quoted
market
price
Valuation
technique
using
observable
market inputs
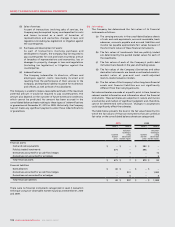
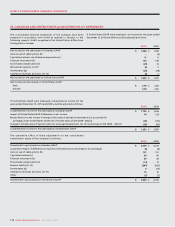
Financial assets:
Cash and cash equivalents $ – $ – $ 383 $ –
Publicly traded investments 675 –496 –
Derivatives accounted for as cash flow hedges – 7 – 73
Derivatives not accounted for as hedges – – – 9
Total financial assets $ 675 $ 7 $ 879 $ 82
Financial liabilities:
Bank advances $ 40 $ – $ – $ –
Derivatives accounted for as cash flow hedges – 901 – 1,080
Derivatives not accounted for as hedges – 6 – 4
Total financial liabilities $ 40 $ 907 $ – $ 1,084
(b) Sales of services:
As part of transactions involving sales of services, the
Company may be required to pay counterparties for costs
and losses incurred as a result of breaches of
representations and warranties, changes in laws and
regulations (including tax legislation) or litigation against
the counterparties.
(c) Purchases and development of assets:
As part of transactions involving purchases and
development of assets, the Company may be required to
pay counterparties for costs and losses incurred as a result
of breaches of representations and warranties, loss or
damages to property, changes in laws and regulations
(including tax legislation) or litigation against the
counterparties.
(d) Indemnifications:
The Company indemnifies its directors, officers and
employees against claims reasonably incurred and
resulting from the performance of their services to the
Company, and maintains liability insurance for its directors
and officers, as well as those of its subsidiaries.
The Company is unable to make a reasonable estimate of the maximum
potential amount it would be required to pay counterparties. The
amount also depends on the outcome of future events and conditions,
which cannot be predicted. No amount has been accrued in the
consolidated balance sheets relating to these types of indemnifications
or guarantees at December 31, 2010 or 2009. Historically, the Company
has not made any significant payments under these indemnifications
or guarantees.
(iii) Fair values:
The Company has determined the fair values of its financial
instruments as follows:
(a) The carrying amounts in the consolidated balance sheets
of cash and cash equivalents, accounts receivable, bank
advances, accounts payable and accrued liabilities and
income tax payable approximate fair values because of
the short-term nature of these financial instruments.
(b) The fair values of investments that are publicly traded
are determined by the quoted market values for each of
the investments.
(c) The fair values of each of the Company’s public debt
instruments are based on the year-end trading values.
(d) The fair values of the Company’s Derivatives and other
derivative instruments are based on estimated mark-to-
market value at year-end and credit-adjusted
mark-to-market valuation models.
(e) The fair values of the Company’s other long-term financial
assets and financial liabilities are not significantly
different from their carrying amounts.
Fair value estimates are made at a specific point in time, based on
relevant market information and information about the financial
instruments. These estimates are subjective in nature and involve
uncertainties and matters of significant judgment and, therefore,
cannot be determined with precision. Changes in assumptions
could significantly affect the estimates.
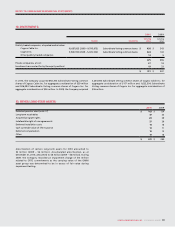
The table below presents the level in the fair value hierarchy into
which the fair values of financial instruments that are carried at
fair value on the consolidated balance sheets are categorized:
There were no financial instruments categorized in Level 3 (valuation
technique using non-observable market inputs) as at December 31, 2010
and 2009.