Rogers 2010 Annual Report Download - page 69
Download and view the complete annual report
Please find page 69 of the 2010 Rogers annual report below. You can navigate through the pages in the report by either clicking on the pages listed below, or by using the keyword search tool below to find specific information within the annual report.-
 1
1 -
2
-
3
-
4
-
5
-
6
-
7
-
8
-
9
-
10
-
11
-
12
-
13
-
14
-
15
-
16
-
17
-
18
-
19
-
20
-
21
-
22
-
23
-
24
-
25
-
26
-
27
-
28
-
29
-
30
-
31
-
32
-
33
-
34
-
35
-
36
-
37
-
38
-
39
-
40
-
41
-
42
-
43
-
44
-
45
-
46
-
47
-
48
-
49
-
50
-
51
-
52
-
53
-
54
-
55
-
56
-
57
-
58
-
 59
59 -
 60
60 -
 61
61 -
 62
62 -
 63
63 -
 64
64 -
 65
65 -
 66
66 -
 67
67 -
 68
68 -
 69
69 -
 70
70 -
 71
71 -
 72
72 -
 73
73 -
 74
74 -
 75
75 -
 76
76 -
 77
77 -
 78
78 -
 79
79 -
80
-
81
-
82
-
83
-
84
-
85
-
86
-
87
-
88
-
89
-
90
-
91
-
92
-
93
-
94
-
95
-
96
-
97
-
98
-
99
-
100
-
101
-
102
-
103
-
104
-
105
-
106
-
107
-
108
-
109
-
110
-
111
-
112
-
113
-
114
-
115
-
116
-
117
-
118
-
119
-
120
 |
 |

ROGERS COMMUNICATIONS INC. 2010 ANNUAL REPORT 73
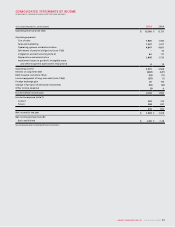
MANAGEMENT’S DISCUSSION AND ANALYSIS OF FINANCIAL CONDITION AND RESULTS OF OPERATIONS
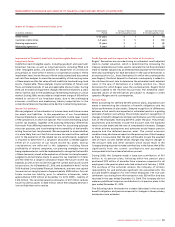
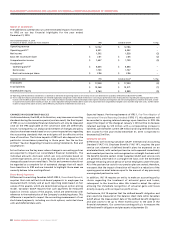
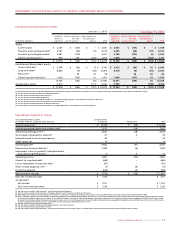
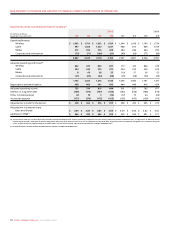
FIVE-YEAR SUMMARY OF CONSOLIDATED FINANCIAL RESULTS
(1) As defined. See the section entitled “Key Performance Indicators and Non-GAAP Measures”.
(2) Cash flow from operations before changes in working capital amounts.
(3) Debt includes net derivative liabilities at the risk free mark-to-market value and is net of cash as applicable.
(4) Prior period shares and per share amounts have been retroactively adjusted to reflect a two-for-one-split of the Company’s Class A Voting and Class B Non-Voting shares on December 29, 2006.
Years ended December 31,
(In millions of dollars, except per share amounts) 2010 2009 2008 2007 2006
Income and Cash Flow:
Revenue
Wireless $ 6,968 $ 6,654 $ 6,335 $ 5,503 $ 4,580
Cable 4,052 3,948 3,809 3,558 3,201
Media 1,501 1,407 1,496 1,317 1,210
Corporate and eliminations (335) (278) (305) (255) (153)
$ 12,186 $ 11,731 $ 11,335 $ 10,123 $ 8,838
Operating profit(1)
Wireless $ 3,146 $ 3,006 $ 2,797 $ 2,532 $ 1,969
Cable 1,402 1,325 1,220 802 890
Media 122 73 142 82 151
Corporate and eliminations (118) (88) (81) (317) (135)
$ 4,552 $ 4,316 $ 4,078 $ 3,099 $ 2,875
Adjusted operating profit(1)
Wireless $ 3,167 $ 3,042 $ 2,806 $ 2,589 $ 1,987
Cable 1,437 1,324 1,233 1,016 916
Media 147 119 142 176 156
Corporate and eliminations (98) (97) (121) (78) (117)
$ 4,653 $ 4,388 $ 4,060 $ 3,703 $ 2,942
Net income $ 1,528 $ 1,478 $ 1,002 $ 637 $ 622
Adjusted net income(1) $ 1,707 $ 1,556 $ 1,260 $ 1,066 $ 684
Cash flow from operations(2) $ 3,800 $ 3,526 $ 3,500 $ 3,135 $ 2,386
Property, plant and equipment expenditures $ 1,839 $ 1,855 $ 2,021 $ 1,796 $ 1,712
Average Class A and Class B shares
outstanding (Ms)(4) 576 621 638 642 642
Net income per share:(4)
Basic $ 2.65 $ 2.38 $ 1.57 $ 1.00 $ 0.99
Diluted 2.65 2.38 1.57 0.99 0.97
Adjusted net income per share:
Basic $ 2.96 $ 2.51 $ 1.98 $ 1.67 $ 1.08
Diluted 2.96 2.51 1.98 1.66 1.07
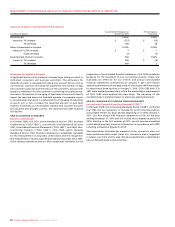
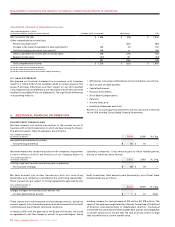
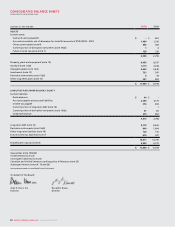
Balance Sheet:
Assets
Property, plant and equipment, net $ 8,493 $ 8,197 $ 7,898 $ 7,289 $ 6,732
Goodwill 3,115 3,018 3,024 3,027 2,779
Intangible assets 2,669 2,643 2,761 2,086 2,152
Investments 721 547 343 485 139
Other assets 2,332 2,613 3,056 2,438 2,303
$ 17,330 $ 17,018 $ 17,0 82 $ 15,325 $ 14,105
Liabilities and Shareholders’ Equity
Long-term debt $ 8,718 $ 8,463 $ 8,506 $ 6,033 $ 6,988
Accounts payable and other liabilities 4,653 4,282 3,860 4,668 2,917
Total liabilities 13,371 12,745 12,366 10,701 9,905
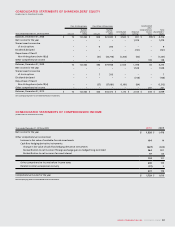
Shareholders’ equity 3,959 4,273 4,716 4,624 4,200
$ 17,330 $ 17,018 $ 17,082 $ 15,325 $ 14,105
Ratios:
Revenue growth 4% 3% 12% 15% 21%
Adjusted operating profit growth 6% 8% 10% 26% 31%
Debt/adjusted operating profit(3) 2.1 2.1 2.1 2.1 2.8
Dividends declared per share(4) $ 1.28 $ 1.16 $ 1.00 $ 0.42 $ 0.08