Rogers 2010 Annual Report Download - page 105
Download and view the complete annual report
Please find page 105 of the 2010 Rogers annual report below. You can navigate through the pages in the report by either clicking on the pages listed below, or by using the keyword search tool below to find specific information within the annual report.-
 1
1 -
2
-
3
-
4
-
5
-
6
-
7
-
8
-
9
-
10
-
11
-
12
-
13
-
14
-
15
-
16
-
17
-
18
-
19
-
20
-
21
-
22
-
23
-
24
-
25
-
26
-
27
-
28
-
29
-
30
-
31
-
32
-
33
-
34
-
35
-
36
-
37
-
38
-
39
-
40
-
41
-
42
-
43
-
44
-
45
-
46
-
47
-
48
-
49
-
50
-
51
-
52
-
53
-
54
-
55
-
56
-
57
-
58
-
59
-
60
-
61
-
62
-
63
-
64
-
65
-
66
-
67
-
68
-
69
-
70
-
71
-
72
-
73
-
74
-
75
-
76
-
77
-
78
-
79
-
80
-
81
-
82
-
83
-
84
-
85
-
86
-
87
-
88
-
89
-
90
-
91
-
92
-
93
-
94
-
 95
95 -
 96
96 -
 97
97 -
 98
98 -
 99
99 -
 100
100 -
 101
101 -
 102
102 -
 103
103 -
 104
104 -
 105
105 -
 106
106 -
 107
107 -
 108
108 -
 109
109 -
 110
110 -
 111
111 -
 112
112 -
 113
113 -
 114
114 -
 115
115 -
116
-
117
-
118
-
119
-
120
 |
 |

NOTES TO CONSOLIDATED FINANCIAL STATEMENTS
ROGERS COMMUNICATIONS INC. 2010 ANNUAL REPORT 109
Plan assets primarily comprise pooled funds that invest in common
stocks and bonds. The pooled Canadian equity fund has investments in
the Company’s equity securities comprising approximately 1% of the
pooled fund. This results in approximately $1 million (2009 – $1 million)
of the plans’ assets being indirectly invested in the Company’s
equity securities.
The Company makes contributions to the plans to secure the benefits of
plan members and invests in permitted investments using the target
ranges established by the Pension Committee of the Company. The
Pension Committee reviews actuarial assumptions on an annual basis.
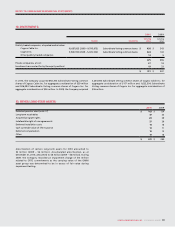
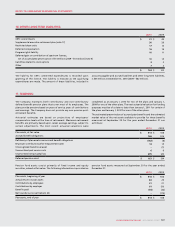
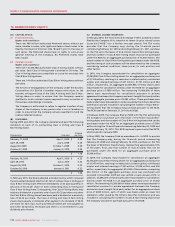
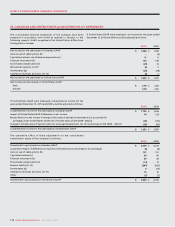
(B) ALLOCATION OF PLAN ASSETS:
Percentage of plan assets at
measurement date Target
asset allocation
percentage
Asset category 2010 2009
Equity securities 58.2% 59.4% 50% to 70%
Debt securities 41.5% 39.9% 35% to 45%
Other – cash 0.3% 0.7% 0% to 5%
100.0% 100.0%
Expected contributions by the Company in 2011 are estimated to be
approximately $70 million.
Employee contributions for 2011 are assumed to be at levels similar to
2010 on the assumption staffing levels in the Company will remain the
same on a year-over-year basis.
(D) SETTLEMENT OF PENSION OBLIGATIONS:
During 2009, the Company made a lump-sum contribution of $61
million to its pension plans, following which, the pension plans
purchased $172 million of annuities from insurance companies for all
employees in the pension plans who had retired as of January 1, 2009.
The purchase of the annuities relieves the Company of the primary
responsibility for, and eliminates significant risk associated with, the
accrued benefit obligation for the retired employees. The non-cash
settlement loss arising from this settlement of pension obligations was
$30 million.
The Company did not have any curtailment gains or losses in 2010
and 2009.
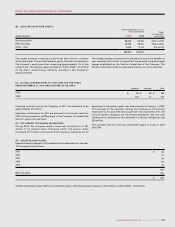
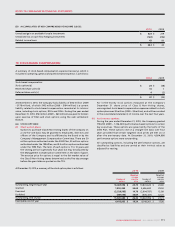
(C) ACTUAL CONTRIBUTIONS TO THE PLANS FOR THE YEARS
ENDED DECEMBER 31, 2010 AND 2009 ARE AS FOLLOWS:
Employer Employee Total
2010 $ 61 $ 21 $ 82
2009 120 21 141
(E) EXPECTED CASH FLOWS:
Expected benefit payments for funded and unfunded plans for the next
10 fiscal years are as follows:
2011 $ 26
2012 27
2013 29
2014 30
2015 32
144
Next five years 195
$ 339
Certain subsidiaries have defined contribution plans with total pension expense of $2 million in 2010 (2009 – $2 million).