Rogers 2010 Annual Report Download - page 33
Download and view the complete annual report
Please find page 33 of the 2010 Rogers annual report below. You can navigate through the pages in the report by either clicking on the pages listed below, or by using the keyword search tool below to find specific information within the annual report.-
 1
1 -
2
-
3
-
4
-
5
-
6
-
7
-
8
-
9
-
10
-
11
-
12
-
13
-
14
-
15
-
16
-
17
-
18
-
19
-
20
-
21
-
22
-
 23
23 -
 24
24 -
 25
25 -
 26
26 -
 27
27 -
 28
28 -
 29
29 -
 30
30 -
 31
31 -
 32
32 -
 33
33 -
 34
34 -
 35
35 -
 36
36 -
 37
37 -
 38
38 -
 39
39 -
 40
40 -
 41
41 -
 42
42 -
 43
43 -
44
-
45
-
46
-
47
-
48
-
49
-
50
-
51
-
52
-
53
-
54
-
55
-
56
-
57
-
58
-
59
-
60
-
61
-
62
-
63
-
64
-
65
-
66
-
67
-
68
-
69
-
70
-
71
-
72
-
73
-
74
-
75
-
76
-
77
-
78
-
79
-
80
-
81
-
82
-
83
-
84
-
85
-
86
-
87
-
88
-
89
-
90
-
91
-
92
-
93
-
94
-
95
-
96
-
97
-
98
-
99
-
100
-
101
-
102
-
103
-
104
-
105
-
106
-
107
-
108
-
109
-
110
-
111
-
112
-
113
-
114
-
115
-
116
-
117
-
118
-
119
-
120
 |
 |
ROGERS COMMUNICATIONS INC. 2010 ANNUAL REPORT 37
MANAGEMENT’S DISCUSSION AND ANALYSIS OF FINANCIAL CONDITION AND RESULTS OF OPERATIONS
operations. Under this arrangement, most of its co-location sites and
related equipment were sold. In addition, the sale involved residential
circuit-switched lines, with the customers served by these facilities
being migrated from Cable Operations to a third party reseller starting
towards the end of the third quarter of 2010 and continuing over the
first several months of 2011. During 2010, approximately 30,000 of these
subscribers were migrated, leaving approximately 46,000 lines which
will be migrated during early 2011. For the year ended December 31,
2010 the revenue reported by Cable Operations associated with the
residential circuit-switched telephony business being divested totalled
approximately $61 million.
Excluding the impact of the declining circuit-switched telephony
business that Cable is in the process of divesting, the year-over-year
revenue growth for Rogers Home Phone and Cable Operations for 2010
wouldhavebeen8%and5%,respectively.
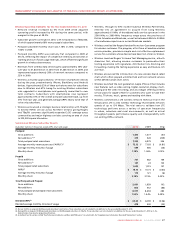
Cable Operations Operating Expenses
The decrease in Cable Operations’ operating expenses for 2010,
compared to 2009, was primarily due to cost reductions and efficiency
initiatives across various functions. Cable Operations continues to
focus on implementing a program of permanent cost reduction and
efficiency improvement initiatives to control the overall growth in
operating expenses.
Cable Operations Adjusted Operating Profit
The year-over-year growth in adjusted operating profit was primarily
the result of the revenue growth and cost changes described above. As
a result, Cable Operations’ adjusted operating profit margins increased
to44.7%for2010,comparedto42.2%for2009.
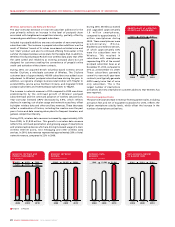
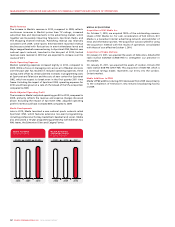
Cable continues to lead the Canadian cable industry in digital cable
penetration. The digital cable subscriber base grew by 4% and
represented75%oftelevisionhouseholdspassedbyourcablenetworks
asatDecember31,2010,comparedto72%asatDecember31,2009.
Increased demand from subscribers for the larger selection of digital
content, video on demand, HDTV and PVR equipment continues to
contribute to the growth in the digital subscriber base and cable
television revenue.
Cable Internet Revenue
The year-over-year increase in Internet revenue for 2010 primarily
reflects the increase in the Internet subscriber base, combined with
Internet services price changes made during 2010 and the timing and
mix of promotional programs.
With the high-speed Internet base at approximately 1.7 million
subscribers,Internetpenetrationisapproximately45%ofthehomes
passedbyourcablenetworksand73%ofourtelevisionsubscriber
base, as at December31,2010.
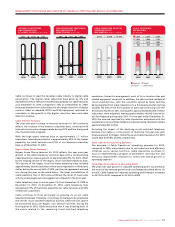
Rogers Home Phone Revenue
Rogers Home Phone revenue for 2010 reflects the year-over-year
growth in the cable telephony customer base with a corresponding
cabletelephonyrevenuegrowthofapproximately8%for2010,offset
by the ongoing decline of the legacy circuit-switched telephony base.
This decline of the legacy circuit-switched telephony base included
approximately 30,000 subscribers which were migrated to a third party
carrier during the second half of 2010, per the sale agreement entered
into during the year, as discussed below. The lower net additions of
cable telephony lines in 2010 versus 2009 are the result of lower sales
activity as campaigns were less aggressive compared to the prior year.
Cabletelephonylinesinservicegrew7%fromDecember31,2009to
December 31, 2010. At December 31, 2010, cable telephony lines
represented27%ofthehomespassedbyourcablenetworksand44%
of television subscribers.
Cable continues to focus principally on growing its on-net cable
telephony line base. Therefore, it continues its strategy to de-emphasize
the off-net circuit-switched telephony business where services cannot
be provisioned fully over Rogers’ own network facilities. During the
third quarter of 2010, Cable announced that it was divesting most of
the assets related to the remaining circuit-switched telephony
20102009
2008
2009
2010
2008
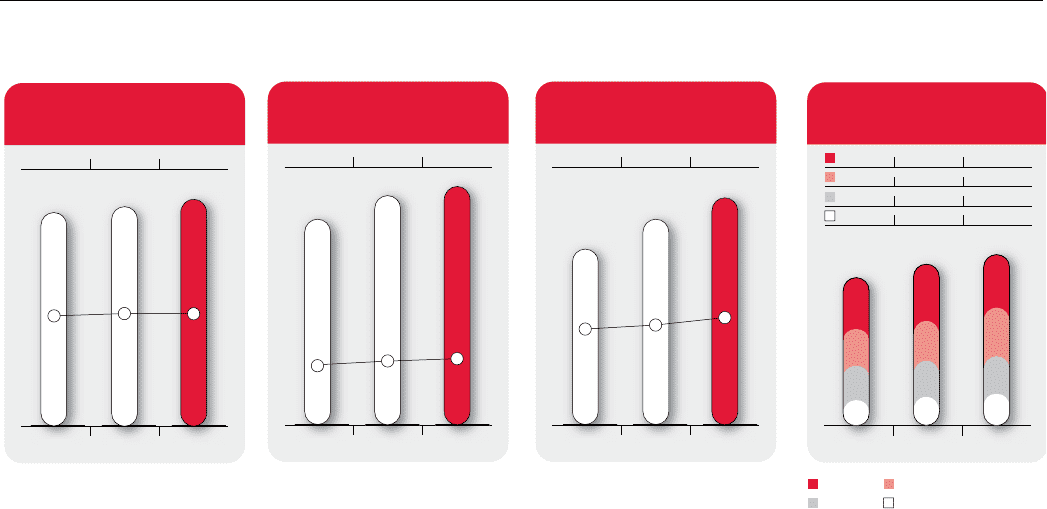
1,7331,550
1,6861,571
1,003840
2,305
1,664
1,619
937
2,2962,320
Television Digital
Internet Home Phone
CABLE SUBSCRIBER
BREAKDOWN
(In thousands)
20102009
2008
2008
201
0
2009
1,003
27%
26%
24%
937840
CABLE TELEPHONY SUBSCRIBERS
AND PENETRATION OF
HOMES PASSED (In thousands)
20102009
2008
2009
200
8
201
0
$1,424$1,298$1,171
CABLE OPERATIONS ADJUSTED
OPERATING PROFIT
AND MARGIN (In millions of dollars)
45%
42%
41%
20102009
2008
2008
201
0
2009
1,686
45%
45%
44%
1,6191,571
INTERNET SUBSCRIBERS
AND PENETRATION
OF HOMES PASSED (In thousands)