Rogers 2010 Annual Report Download - page 40
Download and view the complete annual report
Please find page 40 of the 2010 Rogers annual report below. You can navigate through the pages in the report by either clicking on the pages listed below, or by using the keyword search tool below to find specific information within the annual report.-
 1
1 -
2
-
3
-
4
-
5
-
6
-
7
-
8
-
9
-
10
-
11
-
12
-
13
-
14
-
15
-
16
-
17
-
18
-
19
-
20
-
21
-
22
-
23
-
24
-
25
-
26
-
27
-
28
-
29
-
 30
30 -
 31
31 -
 32
32 -
 33
33 -
 34
34 -
 35
35 -
 36
36 -
 37
37 -
 38
38 -
 39
39 -
 40
40 -
 41
41 -
 42
42 -
 43
43 -
 44
44 -
 45
45 -
 46
46 -
 47
47 -
 48
48 -
 49
49 -
 50
50 -
51
-
52
-
53
-
54
-
55
-
56
-
57
-
58
-
59
-
60
-
61
-
62
-
63
-
64
-
65
-
66
-
67
-
68
-
69
-
70
-
71
-
72
-
73
-
74
-
75
-
76
-
77
-
78
-
79
-
80
-
81
-
82
-
83
-
84
-
85
-
86
-
87
-
88
-
89
-
90
-
91
-
92
-
93
-
94
-
95
-
96
-
97
-
98
-
99
-
100
-
101
-
102
-
103
-
104
-
105
-
106
-
107
-
108
-
109
-
110
-
111
-
112
-
113
-
114
-
115
-
116
-
117
-
118
-
119
-
120
 |
 |

MANAGEMENT’S DISCUSSION AND ANALYSIS OF FINANCIAL CONDITION AND RESULTS OF OPERATIONS
44 ROGERS COMMUNICATIONS INC. 2010 ANNUAL REPORT
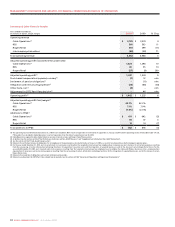
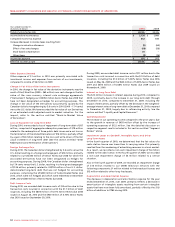
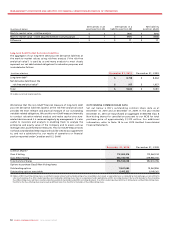
Years ended December 31,
(In millions of dollars) 2010 2009
Statutory income tax rate 30.5% 32.3%
Income before income taxes $ 2,138 $ 1,980
Computed income tax expense 652 640
Increase (decrease) in income taxes resulting from:
Change in valuation allowance (5) (64)
Effect of tax rate changes (69) (58)
Stock-based compensation 35 –
Other items (3) (16)
Income tax expense $ 610 $ 502
Effective income tax rate 28.5% 25.4%
Other Expense (Income)
Other expense of $1 million in 2010 was primarily associated with
investment income and expenses from certain of our investments,
compared to income of $6 million in 2009.
Change in Fair Value of Derivative Instruments
In 2010, the change in fair value of the derivative instruments was the
result of the $16 million (2009 – $65 million) non-cash change in the fair
value of the cross-currency interest rate exchange agreements
(“Derivatives”) hedging our US$350 million Senior Notes due 2038 that
have not been designated as hedges for accounting purposes. This
change in fair value of the Derivatives was primarily caused by the
Canadian dollar’s strengthening by 5.6 cents in 2010 (2009 – 17.4 cents)
versus the U.S. dollar. We have recorded the fair value of our Derivatives
at an estimated credit-adjusted mark-to-market valuation. For the
impact, refer to the section entitled “Mark-to-Market Value
of Derivatives”.
Loss on Repayment of Long-Term Debt
During 2010, we recorded a loss of repayment of long-term debt of $87
million, comprised of aggregate redemption premiums of $79 million
related to the redemption of three public debt issues and a net loss on
the termination of the related Derivatives of $16 million, partially offset
by a gain of $8 million relating to the non-cash write-down of the fair
value increment of long-term debt (See the section entitled “Debt
Redemptions and Termination of Derivatives”).
Foreign Exchange Gain
During 2010, the Canadian dollar strengthened by 5.6 cents versus the
U.S. dollar resulting in a foreign exchange gain of $20 million, primarily
related to our US$350 million of Senior Notes due 2038 for which the
associated Derivatives have not been designated as hedges for
accounting purposes. During 2009, the Canadian dollar strengthened
by 17.4 cents versus the U.S. dollar, resulting in a foreign exchange gain
of $136 million, primarily related to US$750 million of our U.S. dollar-
denominated long-term debt that was not hedged for accounting
purposes, comprising the US$400 million of Subordinated Notes due
2012, which were not hedged and which were redeemed in December
2009, and US$350 million of Senior Notes due 2038.
Debt Issuance Costs
During 2010, we recorded debt issuance costs of $10 million due to the
transaction costs incurred in connection with the $1.7 billion of debt
issuances,includingthe$800millionof6.11%SeniorNotesdue2040
issuedonAugust25,2010andthe$900millionof4.70%SeniorNotes
due 2020 issued on September 29, 2010.
During 2009, we recorded debt issuance costs of $11 million due to the
transaction costs incurred in connection with the $2.0 billion of debt
issuances,includingthe$1.0billionof5.80%SeniorNotesdue2016
issuedonMay26,2009andthe$500millionof5.38%SeniorNotesdue
2019 and $500 million of 6.68% Senior Notes due 2039 issued on
November 4, 2009.
Interest on Long-Term Debt
The $22 million increase in interest expense during 2010, compared to
2009, is primarily due to the increase in our long-term debt through
December 31, 2010, compared to December 31, 2009, including the
impact of Derivatives, partially offset by the decrease in the weighted-
average interest rate on long-term debt at December 31, 2010 compared
to December 31, 2009, largely due to refinancing activity. See the
section entitled “Liquidity and Capital Resources”.
Operating Income
The increase in our operating income compared to the prior year is due
to the growth in revenue of $455 million offset by the increase of
operating expenses of $122 million. See the detailed discussion on
respective segment results included in this section entitled “Segment
Review” above.
Impairment Losses on Goodwill, Intangible Assets and Other
Long-Term Assets
In the fourth quarter of 2010, we determined that the fair value of a
radio station licence was lower than its carrying value. This primarily
resulted from the weakening of advertising revenues in a local market.
As a result, we recorded a non-cash impairment charge of $6 million
related to the radio licence. In the fourth quarter of 2009, we recorded
a non-cash impairment charge of $4 million related to a similar
situation.
Also in the fourth quarter of 2009, we recorded an impairment charge
of $14 million related to our OMNI television network with the
following components: $1 million related to the broadcast licences and
$13 million related to other long-lived assets.
Depreciation and Amortization Expense
The decrease in depreciation and amortization expense for the year
ended December 31, 2010, over 2009, primarily reflects a decrease in
amortization of intangible assets resulting from certain intangible
assets that have now been fully amortized, partially offset by the $1.8
billion of additions to PP&E during 2010.