Rogers 2010 Annual Report Download - page 41
Download and view the complete annual report
Please find page 41 of the 2010 Rogers annual report below. You can navigate through the pages in the report by either clicking on the pages listed below, or by using the keyword search tool below to find specific information within the annual report.-
 1
1 -
2
-
3
-
4
-
5
-
6
-
7
-
8
-
9
-
10
-
11
-
12
-
13
-
14
-
15
-
16
-
17
-
18
-
19
-
20
-
21
-
22
-
23
-
24
-
25
-
26
-
27
-
28
-
29
-
30
-
 31
31 -
 32
32 -
 33
33 -
 34
34 -
 35
35 -
 36
36 -
 37
37 -
 38
38 -
 39
39 -
 40
40 -
 41
41 -
 42
42 -
 43
43 -
 44
44 -
 45
45 -
 46
46 -
 47
47 -
 48
48 -
 49
49 -
 50
50 -
 51
51 -
52
-
53
-
54
-
55
-
56
-
57
-
58
-
59
-
60
-
61
-
62
-
63
-
64
-
65
-
66
-
67
-
68
-
69
-
70
-
71
-
72
-
73
-
74
-
75
-
76
-
77
-
78
-
79
-
80
-
81
-
82
-
83
-
84
-
85
-
86
-
87
-
88
-
89
-
90
-
91
-
92
-
93
-
94
-
95
-
96
-
97
-
98
-
99
-
100
-
101
-
102
-
103
-
104
-
105
-
106
-
107
-
108
-
109
-
110
-
111
-
112
-
113
-
114
-
115
-
116
-
117
-
118
-
119
-
120
 |
 |

ROGERS COMMUNICATIONS INC. 2010 ANNUAL REPORT 45
MANAGEMENT’S DISCUSSION AND ANALYSIS OF FINANCIAL CONDITION AND RESULTS OF OPERATIONS
Stock-based Compensation
Our employee stock option plans attach cash-settled share appreciation
rights (“SARs”) to all new and previously granted options. The SAR
feature allows the option holder to elect to receive in cash an amount
equal to the intrinsic value, being the excess market price of the Class B
Non-Voting share over the exercise price of the option, instead of
exercising the option and acquiring Class B Non-Voting shares. All
outstanding stock options are classified as liabilities and are carried at
their intrinsic value, as adjusted for vesting, measured as the difference
between the current stock price and the option exercise price. The
intrinsic value of the liability is marked-to-market each period and is
amortized to expense over the period in which the related services are
rendered, which is usually the graded vesting period, or, as applicable,
over the period to the date an employee is eligible to retire, whichever
is shorter.
The liability for stock-based compensation expense is recorded based
on the intrinsic value of the options, as described above, and the
expense is impacted by the change in the price of RCI’s Class B Non-
Voting shares during the life of the option. At December 31, 2010, we
had a liability of $162 million (2009 – $178 million) related to stock-
based compensation recorded at its intrinsic value, including stock
options, restricted share units and deferred share units. In the year
ended December 31, 2010, $58 million (2009 – $63 million) was paid to
holders of stock options, restricted share units and deferred share units
upon exercise using the SAR feature.
In March 2010, the federal budget introduced proposed changes that
impact the tax deductibility of cash-settled stock options. The proposed
legislative changes were enacted in December 2010. As a result, the
Company recorded an income tax charge of $35 million to reduce
future tax assets previously recognized with respect to its stock option
related liabilities.
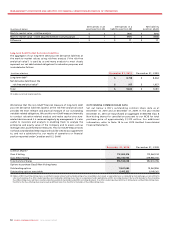
A summary of stock-based compensation expense is as follows:
Integration and Restructuring Expenses
During the year ended December 31, 2010, we incurred $40 million of
integration and restructuring expenses to improve our cost structure
related to i) severances resulting from the targeted restructuring of our
employee base ($21 million); ii) restructuring expenses related to the
outsourcing of certain information technology functions ($9 million);
iii) acquisition transaction costs incurred and the integration of
acquired businesses and related restructuring ($5 million); and iv) the
closure of certain retail stores ($5 million).
During the year ended December 31, 2009, we incurred $117 million of
integration and restructuring expenses related to: i) severances
resulting from the targeted restructuring of our employee base to
combine our Cable and Wireless businesses into a communications
organization and to improve our cost structure in light of the then
current economic and competitive conditions ($87 million); ii)
severances and restructuring expenses related to the outsourcing of
certain information technology functions ($23 million); iii) the
integration of acquired businesses and related restructuring ($3
million); and iv) the closure of certain retail stores ($4 million).
Other Items
During the year ended December 31, 2010, we recorded $14 million of
net adjustments related to the resolution of obligations and accruals
relating to prior periods.
Adjusted Operating Profit
As discussed above, Wireless, Cable and Media contributed to the
increase in adjusted operating profit for the year ended
December31,2010 compared to 2009.
Consolidated adjusted operating profit increased to $4,653 million in
2010, compared to $4,388 million in 2009. Adjusted operating profit for
2010 and 2009, respectively, excludes: (i) stock-based compensation
expense (recovery) of $47 million and $(33) million; (ii) integration and
restructuring expenses of $40 million and $117 million; (iii) other items
of $14 million and $nil; (iv) an adjustment for CRTC Part II fees related to
prior periods of $nil and $(61) million; (v) contract termination fees of
$nil and $19 million; and (vi) settlement of pension obligations of $nil
and $30 million.
For details on the determination of adjusted operating profit, which is
a non-GAAP measure, see the sections entitled “Supplementary
Information: Non-GAAP Calculations” and “Key Performance Indicators
and Non-GAAP Measures”.
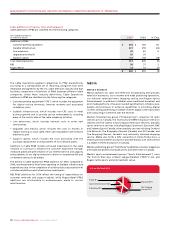
Employees
Employee remuneration represents a material portion of our expenses.
At December 31, 2010, we had approximately 25,100 (2009 – 25,900)
full-time equivalent employees (“FTEs”) across all of our operating
groups, including our shared services organization and corporate
office, which was a slight decrease from the level at December 31, 2009.
Reductions associated with operational efficiencies and the integration
of our Cable and Wireless organizations and reductions in Media
associated with improvements to its cost structure, were partially offset
by increases in our shared services staffing and customer facing
functions. Total remuneration costs incurred for employees (both full
and part-time) in 2010 was approximately $1,715 million, which is
unchanged from 2009. The amount of remuneration costs incurred for
employees decreased due to the number of FTEs compared to 2009, but
was offset by the increase in stock-based compensation expense to $47
million compared to a $33 million recovery in 2009, as a result of
fluctuations in the Company’s stock price.
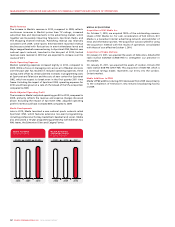
ADDITIONS TO PP&E
For details on the additions of PP&E for the Wireless, Cable and Media
segments, refer to the section entitled “Segment Review”.
Corporate Additions to PP&E
The corporate additions to PP&E included $133 million for the year
ended December 31, 2010 and $151 million for the year ended December
31, 2009, both of which related to spending on an enterprise-wide
billing and business support system initiative.
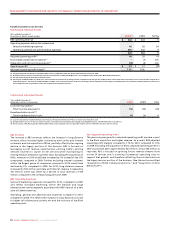
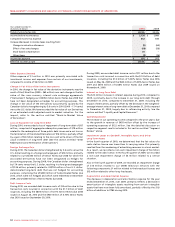
Stock-based Compensation Expense (Recovery)
Included in Operating, General and
Administrative Expenses
Years ended December 31,
(In millions of dollars) 2010 2009
Wireless $ 11 $ –
Cable 7(12)
Media 9(8)
Corporate 20 (13)
$ 47 $ (33)