Rogers 2010 Annual Report Download - page 23
Download and view the complete annual report
Please find page 23 of the 2010 Rogers annual report below. You can navigate through the pages in the report by either clicking on the pages listed below, or by using the keyword search tool below to find specific information within the annual report.-
 1
1 -
2
-
3
-
4
-
5
-
6
-
7
-
8
-
9
-
10
-
11
-
12
-
 13
13 -
 14
14 -
 15
15 -
 16
16 -
 17
17 -
 18
18 -
 19
19 -
 20
20 -
 21
21 -
 22
22 -
 23
23 -
 24
24 -
 25
25 -
 26
26 -
 27
27 -
 28
28 -
 29
29 -
 30
30 -
 31
31 -
 32
32 -
 33
33 -
34
-
35
-
36
-
37
-
38
-
39
-
40
-
41
-
42
-
43
-
44
-
45
-
46
-
47
-
48
-
49
-
50
-
51
-
52
-
53
-
54
-
55
-
56
-
57
-
58
-
59
-
60
-
61
-
62
-
63
-
64
-
65
-
66
-
67
-
68
-
69
-
70
-
71
-
72
-
73
-
74
-
75
-
76
-
77
-
78
-
79
-
80
-
81
-
82
-
83
-
84
-
85
-
86
-
87
-
88
-
89
-
90
-
91
-
92
-
93
-
94
-
95
-
96
-
97
-
98
-
99
-
100
-
101
-
102
-
103
-
104
-
105
-
106
-
107
-
108
-
109
-
110
-
111
-
112
-
113
-
114
-
115
-
116
-
117
-
118
-
119
-
120
 |
 |

ROGERS COMMUNICATIONS INC. 2010 ANNUAL REPORT 27
MANAGEMENT’S DISCUSSION AND ANALYSIS OF FINANCIAL CONDITION AND RESULTS OF OPERATIONS
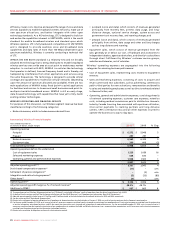
Wireless Operating Highlights For the Year Ended December31,2010
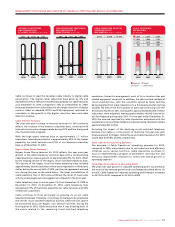
• Network revenue increased by 5% from 2009 while adjusted
operating profit increased by 4% during the same period, with
marginsfortheyearat48.2%.
• Subscribergrowthcontinuedin2010,withnetadditionsof466,000,
ofwhichapproximately68%werepostpaidsubscribers.
• Postpaidsubscribermonthlychurnwas1.18%in2010,comparedto
1.06%in2009.
• Postpaid monthly ARPU was relatively flat compared to 2009 at
$73.12, reflecting the impact of competitive intensity and declines in
roaming and out-of-plan usage revenues, which offset the significant
growth in wireless data revenue.
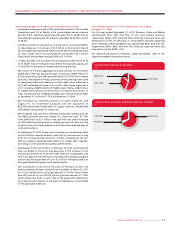
• Revenuesfromwirelessdataservicesgrewapproximately34%year-
over-year to $1,834 million in 2010 from $1,366 million in 2009, and
representedapproximately28%ofnetworkrevenuecomparedto
22%in2009.
• Wirelessactivatedapproximately1.9millionsmartphonedevices
during the year, predominantly iPhone, BlackBerry and Android
devices.Approximately33%oftheseactivationswereforsubscribers
new toWireless and 67%beingforexisting Wirelesssubscribers
who upgraded to smartphones and generally committed to new
term contracts. Subscribers with smartphones now represent
approximately41%oftheoverallpostpaidsubscriberbase,upfrom
31%fromlastyear,andgenerateaverageARPUnearlytwicethatof
voice only subscribers.
• WirelessannouncedastrategicbusinessrelationshipwithTBayTel
to extend HSPA+ service across Northern Ontario giving Rogers
and TBayTel customers significantly expanded 3.5G coverage across
communities and major highway corridors covering an area of close
to 300,000 square kilometres.
• Wireless,throughits50%-ownedInukshukWirelessPartnership,
entered into an agreement to acquire from Craig Wireless
approximately 61 MHz of broadband radio service spectrum in the
2500 MHz to 2690 MHz frequency range across the provinces of
British Columbia and Manitoba, as well as between 6 MHz to 24 MHz
of miscellaneous spectrum in certain Manitoba markets.
• WirelessunveiledtheRogersHandsetProtectionGuaranteeprogram
for wireless customers. The program, a first from a Canadian wireless
service provider, provides a simple and cost effective replacement
service for customers whose devices have been lost, stolen or broken.
• WirelesslaunchedRogers’ExtremeTextMessagingservice,aNorth
American first, allowing wireless customers to personalize their
texting experience with signatures, distribution lists, blocking and
forwarding, making the texting experience as easy and feature-rich
as e-mail.
• Wirelessannouncedtheintroductionofanewwirelessbrandcalled
chatr which offers prepaid unlimited talk and text network services
within defined urban chatr zones.
• WirelesslaunchedthenextgenerationAppleiPhone4thatincludes
new features such as video calling, higher-resolution display, multi-
tasking and HD video recording, and also began offering wireless
service plans for Apple’s iPad for customers who want to take their
movies, TV shows, music, games and reading with them.
• WirelesscommencedaLTEwirelessnetworktechnicaltrialinthe
Ottawa area. LTE is a 4G wireless technology that enables network
speeds of up to 150 Mbps. The trial seeks to validate how LTE
technology performs across a variety of spectrum frequencies
in urban, suburban and rural environments, as well as actual
throughput speeds, performance quality and interoperability with
our existing HSPA+ network.
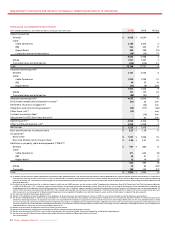
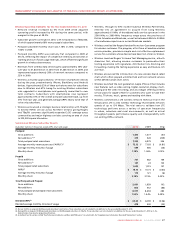
(Subscriber statistics in thousands, except ARPU, churn and usage) 2010 2009 Chg
Postpaid
Gross additions 1,330 1,377 (47)
Net additions (1)(2) 319 528 (209)
Total postpaid retail subscribers 7,325 6,979 346
Average monthly revenue per user (“ARPU”)(3) $ 73.12 $ 73.93 $ (0.81)
Average monthly minutes of usage 559 585 (26)
Monthly churn 1.18% 1.06% 0.12%
Prepaid
Gross additions 731 582 149
Net additions (2) 147 24 123
Total prepaid retail subscribers 1,652 1,515 137
ARPU(3) $ 16.10 $ 16.73 $ (0.63)
Average monthly minutes of usage 115 121 (6)
Monthly churn 3.18% 3.15% 0.03%
Total Postpaid and Prepaid
Gross additions 2,061 1,959 102
Net additions 466 552 (86)
Total postpaid and prepaid retail subscribers 8,977 8,494 483
Monthly churn 1.53% 1.44% 0.09%
Blended ARPU(3) $ 63.03 $ 63.59 $ (0.56)
Blended average monthly minutes of usage 478 500 (22)
Summarized Wireless Subscriber Results
(1) On July 9, 2010, we acquired 44,000 postpaid subscribers from Cityfone. These subscribers are not included in net additions for the year ended December 31, 2010.
(2) During 2010, we migrated 17,000 postpaid subscribers and 10,000 prepaid subscribers to TBayTel. These subscribers are not included in net additions for the year ended December 31, 2010 nor in the
determination of postpaid or prepaid monthly churn.
(3) As defined. See the section entitled “Key Performance Indicators and Non-GAAP Measures”. As calculated in the “Supplementary Information: Non-GAAP Calculations” section.