Rogers 2010 Annual Report Download - page 11
Download and view the complete annual report
Please find page 11 of the 2010 Rogers annual report below. You can navigate through the pages in the report by either clicking on the pages listed below, or by using the keyword search tool below to find specific information within the annual report.-
 1
1 -
 2
2 -
 3
3 -
 4
4 -
 5
5 -
 6
6 -
 7
7 -
 8
8 -
 9
9 -
 10
10 -
 11
11 -
 12
12 -
 13
13 -
 14
14 -
 15
15 -
 16
16 -
 17
17 -
 18
18 -
 19
19 -
 20
20 -
 21
21 -
 22
22 -
23
-
24
-
25
-
26
-
27
-
28
-
29
-
30
-
31
-
32
-
33
-
34
-
35
-
36
-
37
-
38
-
39
-
40
-
41
-
42
-
43
-
44
-
45
-
46
-
47
-
48
-
49
-
50
-
51
-
52
-
53
-
54
-
55
-
56
-
57
-
58
-
59
-
60
-
61
-
62
-
63
-
64
-
65
-
66
-
67
-
68
-
69
-
70
-
71
-
72
-
73
-
74
-
75
-
76
-
77
-
78
-
79
-
80
-
81
-
82
-
83
-
84
-
85
-
86
-
87
-
88
-
89
-
90
-
91
-
92
-
93
-
94
-
95
-
96
-
97
-
98
-
99
-
100
-
101
-
102
-
103
-
104
-
105
-
106
-
107
-
108
-
109
-
110
-
111
-
112
-
113
-
114
-
115
-
116
-
117
-
118
-
119
-
120
 |
 |

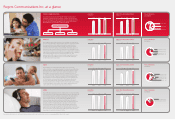
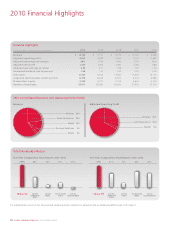
2010 Financial and Operating Highlights
The following represents a sampling of Rogers Communications Inc.’s 2010 performance highlights.
Delivered 4% consolidated revenue
growth with contributions from each
of our three operating segments
CONTINUED TOP-LINE
GROWTH
Expanded adjusted operating profit
margins 80 basis points despite
economic and competitive pressures
OPERATING LEVERAGE
Consolidated pre-tax free cash flow
increased by 14% to $2.1 billion
FREE CASH FLOW GROWTH
Annualized dividend per share increased
10% in 2010 from $1.16 to $1.28 annually
DIVIDEND GROWTH
Repurchased 37.1 million Rogers
Class B shares for $1.3 billion
SHARE BUYBACKS
Issued $1.7 billion of investment grade
long-term notes on favourable terms
reducing the average cost of our
existing debt by 59 basis points
DEBT REFINANCING
Approximately $2.4 billion of available
liquidity with no debt maturities until
2012, and a ratio of 2 times net debt to
adjusted operating profit
BALANCE SHEET STRENGTH
Grew wireless network revenue by
5% to $6.6 billion and subscribers
by 466,000 to 9 million
WIRELESS GROWTH
Completed deployment of HSPA+
21 Mbps wireless network nationally
and launched DOCSIS-3.0 50 Mbps
high-speed Internet service across
entire cable territory
LEADING NETWORKS
Hold an approximate 45% market share
of smartphone customers in Canada
based upon analyst estimates
SMARTPHONE LEADERSHIP
34% wireless data revenue growth
with data as a percent of network
revenue expanding to 28%
DOUBLE-DIGIT WIRELESS
DATA GROWTH
Activated 1.9 million smartphones
helping bring smartphone
penetration to 41% of postpaid
subscriber base
HIGHER VALUE WIRELESS
SUBSCRIBERS
Grew high-speed Internet and cable
telephony penetration levels to 73%
and 44% of television subscribers,
respectively
INTERNET AND TELEPHONY
SERVICES PENETRATION
Enhanced position in SME market with
the aquisition of Blink and Atria, who
offer on-net data centric services to the
medium sized business segment
BUSINESS SEGMENT
OPPORTUNITY
Media entered into strategic content
partnerships with the Vancouver
Canucks, Edmonton Oilers and Calgary
Flames and launched Sportsnet ONE
focused on live event programming
MEDIA PARTNERSHIPS
For a detailed discussion of our financial and operating metrics and results, please see the accompanying MD&A later in this report.
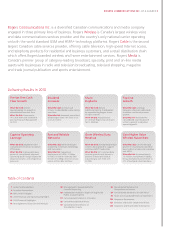
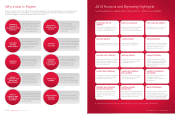
Why invest in Rogers
Rogers Communications, through its three operating segments, has excellent positions in growing markets,
powerful brands, proven management, a long record of driving growth and shareholder value, and the
financial strength to continue its growth well into the future.
Canada’s largest wireless carrier
and a leading cable television
provider, offering a ‘quadruple
play’ of wireless, television,
Internet and telephony services
to consumers and businesses.
LEADER IN
CANADIAN
COMMUNICATIONS
INDUSTRY
A leading provider of
communications and
entertainment products and
services that are increasingly
becoming necessities in
today’s world.
MUST-HAVE
PRODUCTS AND
SERVICES
Powerful and well balanced
national product distribution
network consisting of more
than 2,900 Rogers-owned,
dealer and retail outlets.
EXTENSIVE
PRODUCT
DISTRIBUTION
NETWORK
RCI common stock actively trades
on the TSX and NYSE, with average
daily trading volume greater than
two million shares. Each share pays
an annualized dividend of $1.42
per share in 2011.
HEALTHY
LIQUIDITY AND
MEANINGFUL
DIVIDENDS
Majority of revenue and cash flow
is generated from wireless and
broadband services, the healthiest
and fastest growing segments of
the communications industry.
SUPERIOR
ASSET MIX
Nationally recognized and
highly respected brands that
stand strongly in Canada for
innovation, entrepreneurial
spirit, choice and value.
POWERFUL
BRANDS
Proven 30-year public market
track record of long-term index-
beating shareholder value creation
TRACK RECORD
OF VALUE
CREATION
Financially strong with an
investment grade balance
sheet, conservative debt leverage
and significant available liquidity.
FINANCIALLY
STRONG
Unique and complementary
collection of leading broadcast
radio and television, specialty
TV, magazine and sports
entertainment assets.
CATEGORY
LEADING
MEDIA ASSETS
Experienced, performance-
oriented management and
operating teams with solid
industry expertise, technical
depth and company tenures.
PROVEN
LEADERSHIP AND
OPERATING
MANAGEMENT
14 ROGERS COMMUNICATIONS INC. 2010 ANNUAL REPORT ROGERS COMMUNICATIONS INC. 2010 ANNUAL REPORT 15