Rogers 2010 Annual Report Download - page 86
Download and view the complete annual report
Please find page 86 of the 2010 Rogers annual report below. You can navigate through the pages in the report by either clicking on the pages listed below, or by using the keyword search tool below to find specific information within the annual report.-
 1
1 -
2
-
3
-
4
-
5
-
6
-
7
-
8
-
9
-
10
-
11
-
12
-
13
-
14
-
15
-
16
-
17
-
18
-
19
-
20
-
21
-
22
-
23
-
24
-
25
-
26
-
27
-
28
-
29
-
30
-
31
-
32
-
33
-
34
-
35
-
36
-
37
-
38
-
39
-
40
-
41
-
42
-
43
-
44
-
45
-
46
-
47
-
48
-
49
-
50
-
51
-
52
-
53
-
54
-
55
-
56
-
57
-
58
-
59
-
60
-
61
-
62
-
63
-
64
-
65
-
66
-
67
-
68
-
69
-
70
-
71
-
72
-
73
-
74
-
75
-
 76
76 -
 77
77 -
 78
78 -
 79
79 -
 80
80 -
 81
81 -
 82
82 -
 83
83 -
 84
84 -
 85
85 -
 86
86 -
 87
87 -
 88
88 -
 89
89 -
 90
90 -
 91
91 -
 92
92 -
 93
93 -
 94
94 -
 95
95 -
 96
96 -
97
-
98
-
99
-
100
-
101
-
102
-
103
-
104
-
105
-
106
-
107
-
108
-
109
-
110
-
111
-
112
-
113
-
114
-
115
-
116
-
117
-
118
-
119
-
120
 |
 |

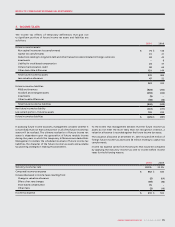
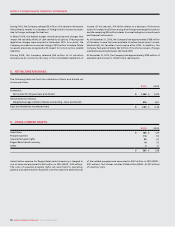
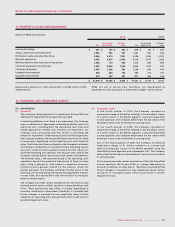
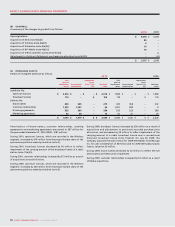
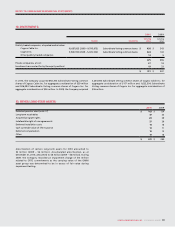
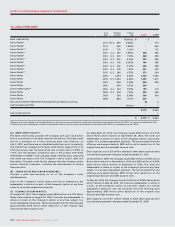
NOTES TO CONSOLIDATED FINANCIAL STATEMENTS
90 ROGERS COMMUNICATIONS INC. 2010 ANNUAL REPORT
2010 2009
Wireless Cable Media
Corporate
items and
eliminations
Consolidated
totals Wireless Cable Media
Corporate
items and
eliminations
Consolidated
totals
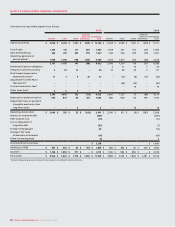
Operating revenue $ 6,968 $ 4,052 $ 1,501 $ (335) $ 12,186 $ 6,654 $ 3,948 $ 1,407 $ (278) $ 11,731
Cost of sales 1,225 181 171 (57) 1,520 1,059 201 167 (47) 1,380
Sales and marketing 628 441 235 (77) 1,227 630 446 209 (78) 1,207
Operating, general and
administrative* 1,948 1,993 948 (103) 4,786 1,923 1,977 912 (56) 4,756
3,167 1,437 147 (98) 4,653 3,042 1,324 119 (97) 4,388
Settlement of pension obligations –––––311 15 130
Integration and restructuring 523 12 –40 33 46 35 3117
Stock-based compensation
expense (recovery)* 11 7 9 20 47 –(12) (8) (13) (33)
Adjustment for CRTC Part II
fees decision* ––––––(46) (15) –(61)
Contract termination fees* –––––– – 19 –19
Other items (net)* 5 5 4 – 14 –––––
3,146 1,402 122 (118) 4,552 3,006 1,325 73 (88) 4,316
Depreciation and amortization 650 807 64 124 1,645 660 808 63 199 1,730
Impairment losses on goodwill,
intangible assets and other
long-term assets – – 6 – 6 – – 18 –18
Operating income (loss) $ 2,496 $ 595 $ 52 $ (242) 2,901 $ 2,346 $ 517 $ (8) $ (287) 2,568
Interest on long-term debt (669) (647)
Debt issuance costs (10) (11)
Loss on repayment of
long-term debt (87) (7)
Foreign exchange gain 20 136
Change in fair value
of derivative instruments (16) (65)
Other income (expense) (1) 6
Income before income taxes $ 2,138 $ 1,980
Additions to PP&E $ 937 $ 662 $ 46 $ 194 $ 1,839 $ 865 $ 693 $ 62 $ 235 $ 1,855
Goodwill $ 1,146 $ 1,058 $ 911 $ – $ 3,115 $ 1,14 0 $ 982 $ 896 $ – $ 3,018
Total assets $ 8,506 $ 5,320 $ 1,918 $ 1,586 $ 17,330 $ 7,988 $ 5,055 $ 1,884 $ 2,091 $ 17,018
*Included with operating, general and administrative expenses in consolidated statements of income.
Information by reportable segment is as follows: