Pizza Hut 2009 Annual Report Download - page 79
Download and view the complete annual report
Please find page 79 of the 2009 Pizza Hut annual report below. You can navigate through the pages in the report by either clicking on the pages listed below, or by using the keyword search tool below to find specific information within the annual report.-
 1
1 -
2
-
3
-
4
-
5
-
6
-
7
-
8
-
9
-
10
-
11
-
12
-
13
-
14
-
15
-
16
-
17
-
18
-
19
-
20
-
21
-
22
-
23
-
24
-
25
-
26
-
27
-
28
-
29
-
30
-
31
-
32
-
33
-
34
-
35
-
36
-
37
-
38
-
39
-
40
-
41
-
42
-
43
-
44
-
45
-
46
-
47
-
48
-
49
-
50
-
51
-
52
-
53
-
54
-
55
-
56
-
57
-
58
-
59
-
60
-
61
-
62
-
63
-
64
-
65
-
66
-
67
-
68
-
 69
69 -
 70
70 -
 71
71 -
 72
72 -
 73
73 -
 74
74 -
 75
75 -
 76
76 -
 77
77 -
 78
78 -
 79
79 -
 80
80 -
 81
81 -
 82
82 -
 83
83 -
 84
84 -
 85
85 -
 86
86 -
 87
87 -
 88
88 -
 89
89 -
90
-
91
-
92
-
93
-
94
-
95
-
96
-
97
-
98
-
99
-
100
-
101
-
102
-
103
-
104
-
105
-
106
-
107
-
108
-
109
-
110
-
111
-
112
-
113
-
114
-
115
-
116
-
117
-
118
-
119
-
120
-
121
-
122
-
123
-
124
-
125
-
126
-
127
-
128
-
129
-
130
-
131
-
132
-
133
-
134
-
135
-
136
-
137
-
138
-
139
-
140
-
141
-
142
-
143
-
144
-
145
-
146
-
147
-
148
-
149
-
150
-
151
-
152
-
153
-
154
-
155
-
156
-
157
-
158
-
159
-
160
-
161
-
162
-
163
-
164
-
165
-
166
-
167
-
168
-
169
-
170
-
171
-
172
-
173
-
174
-
175
-
176
-
177
-
178
-
179
-
180
-
181
-
182
-
183
-
184
-
185
-
186
-
187
-
188
-
189
-
190
-
191
-
192
-
193
-
194
-
195
-
196
-
197
-
198
-
199
-
200
-
201
-
202
-
203
-
204
-
205
-
206
-
207
-
208
-
209
-
210
-
211
-
212
-
213
-
214
-
215
-
216
-
217
-
218
-
219
-
220
 |
 |

21MAR201012032309
Executive Registrant Aggregate Aggregate Aggregate
Contributions Contributions Earnings in Withdrawals/ Balance at
in Last FY in Last FY Last FY Distributions Last FYE
Name ($)(1) ($)(2) ($)(3) ($)(4) ($)(5)
(a) (b) (c) (d) (e) (f)
Novak 4,057,200 1,352,400 9,439,132 228,407 79,535,336
Carucci 905,418 211,264 939,295 631,099 7,353,713
Su 1,609,598 536,533 556,047 1,258,392 4,844,702
Allan 1,965,206 655,069 1,327,178 — 9,052,073
Creed 907,494 302,498 485,604 240,850 3,629,484
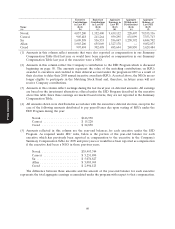
(1) Amounts in this column reflect amounts that were also reported as compensation in our Summary
Compensation Table filed last year or would have been reported as compensation in our Summary
Compensation Table last year if the executive were a NEO.
(2) Amounts in this column reflect the Company’s contribution to the EID Program which is discussed
beginning on page 58. The amounts represent the value of the matching contributions on RSUs
awarded to executives and credited to their deferral account under the program in 2009 as a result of
their election to defer their 2008 annual incentive award into RSUs. As noted above, the NEOs are no
longer eligible to participate in the Matching Stock Fund and, therefore, in future years will not
receive Company contributions.
(3) Amounts in this column reflect earnings during the last fiscal year on deferred amounts. All earnings
are based on the investment alternatives offered under the EID Program described in the narrative
above this table. Since these earnings are market based returns, they are not reported in the Summary
Compensation Table.
(4) All amounts shown were distributed in accordance with the executive’s deferral election, except in the
case of the following amounts distributed to pay payroll taxes due upon vesting of RSUs under the
EID Program during the year:
Novak ..................... $146,930
Carucci .................... $ 15,220
Proxy Statement
Creed ..................... $ 24,850
(5) Amounts reflected in this column are the year-end balances for each executive under the EID
Program. As required under SEC rules, below is the portion of the year-end balance for each
executive which has previously been reported as compensation to the executive in the Company’s
Summary Compensation Table for 2009 and prior years or would have been reported as compensation
if the executive had been a NEO in those previous years.
Novak ..................... $35,993,749
Carucci .................... $ 5,251,890
Su........................ $ 5,076,827
Allan ...................... $ 5,083,969
Creed ..................... $ 2,994,123
The difference between these amounts and the amount of the year-end balance for each executive
represents the total aggregate earnings accumulated under the program with respect to that compensation.
60