Pizza Hut 2009 Annual Report Download - page 70
Download and view the complete annual report
Please find page 70 of the 2009 Pizza Hut annual report below. You can navigate through the pages in the report by either clicking on the pages listed below, or by using the keyword search tool below to find specific information within the annual report.-
 1
1 -
2
-
3
-
4
-
5
-
6
-
7
-
8
-
9
-
10
-
11
-
12
-
13
-
14
-
15
-
16
-
17
-
18
-
19
-
20
-
21
-
22
-
23
-
24
-
25
-
26
-
27
-
28
-
29
-
30
-
31
-
32
-
33
-
34
-
35
-
36
-
37
-
38
-
39
-
40
-
41
-
42
-
43
-
44
-
45
-
46
-
47
-
48
-
49
-
50
-
51
-
52
-
53
-
54
-
55
-
56
-
57
-
58
-
59
-
 60
60 -
 61
61 -
 62
62 -
 63
63 -
 64
64 -
 65
65 -
 66
66 -
 67
67 -
 68
68 -
 69
69 -
 70
70 -
 71
71 -
 72
72 -
 73
73 -
 74
74 -
 75
75 -
 76
76 -
 77
77 -
 78
78 -
 79
79 -
 80
80 -
81
-
82
-
83
-
84
-
85
-
86
-
87
-
88
-
89
-
90
-
91
-
92
-
93
-
94
-
95
-
96
-
97
-
98
-
99
-
100
-
101
-
102
-
103
-
104
-
105
-
106
-
107
-
108
-
109
-
110
-
111
-
112
-
113
-
114
-
115
-
116
-
117
-
118
-
119
-
120
-
121
-
122
-
123
-
124
-
125
-
126
-
127
-
128
-
129
-
130
-
131
-
132
-
133
-
134
-
135
-
136
-
137
-
138
-
139
-
140
-
141
-
142
-
143
-
144
-
145
-
146
-
147
-
148
-
149
-
150
-
151
-
152
-
153
-
154
-
155
-
156
-
157
-
158
-
159
-
160
-
161
-
162
-
163
-
164
-
165
-
166
-
167
-
168
-
169
-
170
-
171
-
172
-
173
-
174
-
175
-
176
-
177
-
178
-
179
-
180
-
181
-
182
-
183
-
184
-
185
-
186
-
187
-
188
-
189
-
190
-
191
-
192
-
193
-
194
-
195
-
196
-
197
-
198
-
199
-
200
-
201
-
202
-
203
-
204
-
205
-
206
-
207
-
208
-
209
-
210
-
211
-
212
-
213
-
214
-
215
-
216
-
217
-
218
-
219
-
220
 |
 |

21MAR201012032
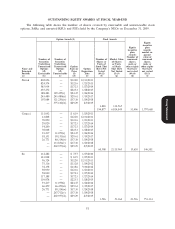
OUTSTANDING EQUITY AWARDS AT FISCAL YEAR-END
The following table shows the number of shares covered by exercisable and unexercisable stock
options, SARs, and unvested RSUs and PSUs held by the Company’s NEOs on December 31, 2009.
Option Awards(1) Stock Awards
Equity
incentive
Equity plan
incentive awards:
plan market or
awards: payout
Number of value of
Number of Number of Number of Market Value unearned unearned
Securities Securities Shares or of Shares shares, shares,
Underlying Underlying Units of or Units units or units or
Unexercised Unexercised Option Stock That of Stock other rights other rights
Name and Options Options Exercise Option Have Not That Have that have that have
Principal (#) (#) Price Expiration Vested Not Vested not vested not vested
Position Exercisable Unexercisable ($) Date (#)(2) ($)(3) (#)(4) ($)(3)
(a) (b) (c) (d) (e) (f) (g) (h) (i)
Novak 802,696 — $12.20 12/31/2011
824,574 — $12.16 1/23/2013
585,934 — $17.23 1/27/2014
455,272 — $22.53 1/28/2015
388,483 129,495(i) $24.47 1/26/2016
245,480 245,480(ii) $29.61 1/19/2017
107,084 321,255(iv) $37.30 1/24/2018
— 575,102(vi) $29.29 2/5/2019
3,848 134,565
194,877 6,814,849 51,406 1,797,668
Carucci 131,092 — $ 8.39 1/25/2011
61,808 — $12.20 12/31/2011
70,090 — $12.16 1/23/2013
Proxy Statement
29,020 — $17.23 1/27/2014
54,200 — $17.23 1/27/2014
78,048 — $22.53 1/28/2015
93,237 31,079(i) $24.47 1/26/2016
58,151 58,151(ii) $29.61 1/19/2017
26,771 80,314(iv) $37.30 1/24/2018
— 133,856(v) $37.30 1/24/2018
— 202,977(vi) $29.29 2/5/2019
60,508 2,115,965 15,630 546,581
Su 112,282 — $ 7.57 1/27/2010
143,008 — $ 8.39 1/25/2011
96,324 — $12.20 12/31/2011
75,316 — $13.28 1/24/2012
72,178 — $13.86 9/30/2012
98,950 — $12.16 1/23/2013
58,040 — $17.23 1/27/2014
117,188 — $17.23 1/27/2014
130,078 — $22.53 1/28/2015
93,237 31,079(i) $24.47 1/26/2016
66,459 66,459(ii) $29.61 1/19/2017
26,771 80,314(iv) $37.30 1/24/2018
— 267,712(v) $37.30 1/24/2018
— 202,977(vi) $29.29 2/5/2019
1,526 53,364 21,536 753,114
51