Pizza Hut 2009 Annual Report Download - page 58
Download and view the complete annual report
Please find page 58 of the 2009 Pizza Hut annual report below. You can navigate through the pages in the report by either clicking on the pages listed below, or by using the keyword search tool below to find specific information within the annual report.-
 1
1 -
2
-
3
-
4
-
5
-
6
-
7
-
8
-
9
-
10
-
11
-
12
-
13
-
14
-
15
-
16
-
17
-
18
-
19
-
20
-
21
-
22
-
23
-
24
-
25
-
26
-
27
-
28
-
29
-
30
-
31
-
32
-
33
-
34
-
35
-
36
-
37
-
38
-
39
-
40
-
41
-
42
-
43
-
44
-
45
-
46
-
47
-
 48
48 -
 49
49 -
 50
50 -
 51
51 -
 52
52 -
 53
53 -
 54
54 -
 55
55 -
 56
56 -
 57
57 -
 58
58 -
 59
59 -
 60
60 -
 61
61 -
 62
62 -
 63
63 -
 64
64 -
 65
65 -
 66
66 -
 67
67 -
 68
68 -
69
-
70
-
71
-
72
-
73
-
74
-
75
-
76
-
77
-
78
-
79
-
80
-
81
-
82
-
83
-
84
-
85
-
86
-
87
-
88
-
89
-
90
-
91
-
92
-
93
-
94
-
95
-
96
-
97
-
98
-
99
-
100
-
101
-
102
-
103
-
104
-
105
-
106
-
107
-
108
-
109
-
110
-
111
-
112
-
113
-
114
-
115
-
116
-
117
-
118
-
119
-
120
-
121
-
122
-
123
-
124
-
125
-
126
-
127
-
128
-
129
-
130
-
131
-
132
-
133
-
134
-
135
-
136
-
137
-
138
-
139
-
140
-
141
-
142
-
143
-
144
-
145
-
146
-
147
-
148
-
149
-
150
-
151
-
152
-
153
-
154
-
155
-
156
-
157
-
158
-
159
-
160
-
161
-
162
-
163
-
164
-
165
-
166
-
167
-
168
-
169
-
170
-
171
-
172
-
173
-
174
-
175
-
176
-
177
-
178
-
179
-
180
-
181
-
182
-
183
-
184
-
185
-
186
-
187
-
188
-
189
-
190
-
191
-
192
-
193
-
194
-
195
-
196
-
197
-
198
-
199
-
200
-
201
-
202
-
203
-
204
-
205
-
206
-
207
-
208
-
209
-
210
-
211
-
212
-
213
-
214
-
215
-
216
-
217
-
218
-
219
-
220
 |
 |

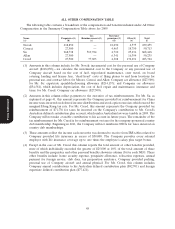
21MAR201012032
determination, the Committee noted that Mr. Novak elected to defer 100% of his 2008 annual incentive
payment, which was otherwise payable in the first quarter of 2009. As a result of this deferral, Mr. Novak
received a matching contribution of RSUs equal in value to 33% of the number of RSUs he received upon
deferral of his bonus. The portion of the deferral attributable to the matching contribution, $1.35 million,
was considered by the Committee in the assessment of Mr. Novak’s long-term incentive compensation
versus the market and in the determination of his SARs award for 2009.
In March 2009, as noted on page 37, the Committee established a Performance Share Plan. The
Committee granted Mr. Novak an award of 25,703 Performance Share Units with a value of $740,000 on
the grant date. This award will distribute shares based on the 3 year compounded annual growth rate of
EPS as described on page 37.
At the conclusion of 2009, the Committee determined Mr. Novak earned an annual incentive award
payment for 2009 performance of $2,993,760. In January 2009, the Committee established Mr. Novak’s
Team Performance Factor measures and targets for 2009 as set forth on page 38. The Committee
determined that the Company’s actual performance against these criteria and goals produced a Team
Performance Factor of 99. Refer to page 35 for information on how this Team Performance Factor was
determined.
For purposes of determining Mr. Novak’s Individual Performance Factor, the Committee considered
the following pre-established individual criteria in addition to the criteria highlighted on page 35:
• EPS Growth
• Return on Invested Capital
• Culture, Diversity and Talent Management
The Committee determined that Mr. Novak attained or exceeded all goals within each of these
criteria, except for Same Store Sales Growth and Profit Growth. In addition, the Committee noted that
that the Company’s EPS growth exceeded its target of 10% for the eighth consecutive year and that the
Company’s total shareholder return ranked in the top quartile of its peer group for the 5 and 10 year
periods. The Committee also noted that development targets were exceeded in the China Division and met
Proxy Statement
in the International Division, and that he was continuing to drive the Achieving Breakthrough Results
culture deep into the organization. Based on this individual performance, the Committee awarded
Mr. Novak an Individual Performance Factor of 135.
After determination of the Team Performance Factor and Individual Performance Factor, Mr. Novak’s
annual incentive was calculated as shown on page 36.
The Committee noted that over the last ten years Mr. Novak has accumulated approximately
2.1 million RSUs solely through the voluntary deferral of his annual incentives totaling approximately
$28 million and that these RSUs and accumulated dividends and earnings thereon had an aggregate value
in excess of $79.5 million as of the end of 2009. These RSUs are payable only in YUM common stock and
are not payable until after Mr. Novak leaves the Company. Through the deferral program, Mr. Novak’s
ownership of these RSUs aligns his compensation with achievement of YUM’s long-term financial and
strategic objectives and the creation of shareholder value. Mr. Novak’s deferral of his annual incentives,
which will not be distributed until after he retires, drives long-term decision making, further aligning his
interests with those of our shareholders.
While the Committee did not specifically discuss why Mr. Novak’s compensation exceeds that of other
NEOs, it does review every year, as part of its process for setting compensation described beginning on
page 33, data from consultants which substantiates on a comparative basis this difference in target
compensation for the CEO role relative to other executive roles. This comparative market data analyzed
over several years supports the differences in salary, annual incentive payment and long term incentives.
39