Pizza Hut 2009 Annual Report Download - page 113
Download and view the complete annual report
Please find page 113 of the 2009 Pizza Hut annual report below. You can navigate through the pages in the report by either clicking on the pages listed below, or by using the keyword search tool below to find specific information within the annual report.-
 1
1 -
2
-
3
-
4
-
5
-
6
-
7
-
8
-
9
-
10
-
11
-
12
-
13
-
14
-
15
-
16
-
17
-
18
-
19
-
20
-
21
-
22
-
23
-
24
-
25
-
26
-
27
-
28
-
29
-
30
-
31
-
32
-
33
-
34
-
35
-
36
-
37
-
38
-
39
-
40
-
41
-
42
-
43
-
44
-
45
-
46
-
47
-
48
-
49
-
50
-
51
-
52
-
53
-
54
-
55
-
56
-
57
-
58
-
59
-
60
-
61
-
62
-
63
-
64
-
65
-
66
-
67
-
68
-
69
-
70
-
71
-
72
-
73
-
74
-
75
-
76
-
77
-
78
-
79
-
80
-
81
-
82
-
83
-
84
-
85
-
86
-
87
-
88
-
89
-
90
-
91
-
92
-
93
-
94
-
95
-
96
-
97
-
98
-
99
-
100
-
101
-
102
-
 103
103 -
 104
104 -
 105
105 -
 106
106 -
 107
107 -
 108
108 -
 109
109 -
 110
110 -
 111
111 -
 112
112 -
 113
113 -
 114
114 -
 115
115 -
 116
116 -
 117
117 -
 118
118 -
 119
119 -
 120
120 -
 121
121 -
 122
122 -
 123
123 -
124
-
125
-
126
-
127
-
128
-
129
-
130
-
131
-
132
-
133
-
134
-
135
-
136
-
137
-
138
-
139
-
140
-
141
-
142
-
143
-
144
-
145
-
146
-
147
-
148
-
149
-
150
-
151
-
152
-
153
-
154
-
155
-
156
-
157
-
158
-
159
-
160
-
161
-
162
-
163
-
164
-
165
-
166
-
167
-
168
-
169
-
170
-
171
-
172
-
173
-
174
-
175
-
176
-
177
-
178
-
179
-
180
-
181
-
182
-
183
-
184
-
185
-
186
-
187
-
188
-
189
-
190
-
191
-
192
-
193
-
194
-
195
-
196
-
197
-
198
-
199
-
200
-
201
-
202
-
203
-
204
-
205
-
206
-
207
-
208
-
209
-
210
-
211
-
212
-
213
-
214
-
215
-
216
-
217
-
218
-
219
-
220
 |
 |

22
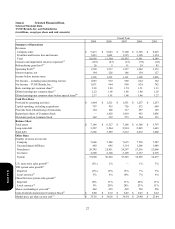
Item 6. Selected Financial Data.
Selected Financial Data
YUM! Brands, Inc. and Subsidiaries
(in millions, except per share and unit amounts)
Fiscal Year
2009 2008 2007 2006 2005
Summar
y
of O
p
erations
Revenues
Com
p
an
y
sales $ 9
,
413 $ 9
,
843 $ 9
,
100 $ 8
,
365 $ 8
,
225
Franchise and license fees and income 1
,
423 1
,
461 1
,
335 1
,
196 1
,
124
Total 10
,
836 11
,
304 10
,
435 9
,
561 9
,
349
Closures and impairment income (expenses)(a) (103 ) (43 ) (35 ) (59 ) (62 )
Refranchising gain (loss)(a) 26 5 11 24 43
Operating Profit(b) 1,590 1,517 1,357 1,262 1,153
Interest expense, net 194 226 166 154 127
Income before income taxes 1,396 1,291 1,191 1,108 1,026
N
et Income – including noncontrolling interest 1,083 972 909 824 762
N
et Income – YUM! Brands, Inc. 1,071 964 909 824 762
Basic earnings per common share(c) 2.28 2.03 1.74 1.51 1.33
Diluted earnings per common share(c) 2.22 1.96 1.68 1.46 1.28
Diluted earnings per common share before special items(d) 2.17 1.91 1.68 1.46 1.27
Cash Flow Data
Provided by operating activities $ 1,404 $ 1,521 $ 1,551 $ 1,257 $ 1,233
Capital spending, excluding acquisitions 797 935 726 572 609
P
roceeds from refranchising of restaurants 194 266 117 257 145
Repurchase shares of Common Stock — 1,628 1,410 983 1,056
Dividends paid on Common Stock 362 322 273 144 123
B
alance Sheet
Total assets $ 7,148 $ 6,527 $ 7,188 $ 6,368 $ 5,797
Long-term debt 3,207 3,564 2,924 2,045 1,649
Total debt 3,266 3,589 3,212 2,272 1,860
Other Data
N
umber of stores at
y
ear end
Company 7,666 7,568 7,625 7,736 7,587
Unconsolidated Affiliates 469 645 1,314 1,206 1,648
Franchisees 26,745 25,911 24,297 23,516 22,666
Licensees 2,200 2,168 2,109 2,137 2,376
System 37,080 36,292 35,345 34,595 34,277
U
.S. same store sales growth(e) (5% ) 2% — 1% 3%
Y
RI system sales growth(e)
Reported (3% ) 10% 15% 7% 9%
Local currency(f) 5% 8% 10% 7% 6%
China Division system sales growth(e)
Reported 10% 31% 31% 26% 13%
Local currency(f) 9% 20% 24% 23% 11%
Shares outstanding at year end(c) 469 459 499 530 556
Cash dividends declared per Common Stock(c) $ 0.80 $ 0.72 $ 0.45 $ 0.43 $ 0.22
M
arket price per share at year end (c) $ 35.38 $ 30.28 $ 38.54 $ 29.40 $ 23.44
Form 10-K