Pizza Hut 2009 Annual Report Download - page 66
Download and view the complete annual report
Please find page 66 of the 2009 Pizza Hut annual report below. You can navigate through the pages in the report by either clicking on the pages listed below, or by using the keyword search tool below to find specific information within the annual report.-
 1
1 -
2
-
3
-
4
-
5
-
6
-
7
-
8
-
9
-
10
-
11
-
12
-
13
-
14
-
15
-
16
-
17
-
18
-
19
-
20
-
21
-
22
-
23
-
24
-
25
-
26
-
27
-
28
-
29
-
30
-
31
-
32
-
33
-
34
-
35
-
36
-
37
-
38
-
39
-
40
-
41
-
42
-
43
-
44
-
45
-
46
-
47
-
48
-
49
-
50
-
51
-
52
-
53
-
54
-
55
-
 56
56 -
 57
57 -
 58
58 -
 59
59 -
 60
60 -
 61
61 -
 62
62 -
 63
63 -
 64
64 -
 65
65 -
 66
66 -
 67
67 -
 68
68 -
 69
69 -
 70
70 -
 71
71 -
 72
72 -
 73
73 -
 74
74 -
 75
75 -
 76
76 -
77
-
78
-
79
-
80
-
81
-
82
-
83
-
84
-
85
-
86
-
87
-
88
-
89
-
90
-
91
-
92
-
93
-
94
-
95
-
96
-
97
-
98
-
99
-
100
-
101
-
102
-
103
-
104
-
105
-
106
-
107
-
108
-
109
-
110
-
111
-
112
-
113
-
114
-
115
-
116
-
117
-
118
-
119
-
120
-
121
-
122
-
123
-
124
-
125
-
126
-
127
-
128
-
129
-
130
-
131
-
132
-
133
-
134
-
135
-
136
-
137
-
138
-
139
-
140
-
141
-
142
-
143
-
144
-
145
-
146
-
147
-
148
-
149
-
150
-
151
-
152
-
153
-
154
-
155
-
156
-
157
-
158
-
159
-
160
-
161
-
162
-
163
-
164
-
165
-
166
-
167
-
168
-
169
-
170
-
171
-
172
-
173
-
174
-
175
-
176
-
177
-
178
-
179
-
180
-
181
-
182
-
183
-
184
-
185
-
186
-
187
-
188
-
189
-
190
-
191
-
192
-
193
-
194
-
195
-
196
-
197
-
198
-
199
-
200
-
201
-
202
-
203
-
204
-
205
-
206
-
207
-
208
-
209
-
210
-
211
-
212
-
213
-
214
-
215
-
216
-
217
-
218
-
219
-
220
 |
 |

21MAR201012032
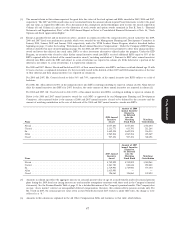
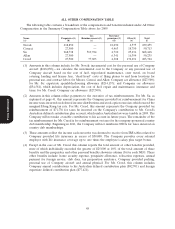
(3) The amounts shown in this column represent the grant date fair values of the stock options and SARs awarded in 2009, 2008 and 2007,
respectively. The 2007 and 2008 award values were recalculated from the amounts shown in prior Proxy Statements to reflect the grant
date fair value, as required by SEC rules. For a discussion of the assumptions and methodologies used to value the awards reported in
Column (d) and Column (e), please see the discussion of stock awards and option awards contained in Part II, Item 8, ‘‘Financial
Statements and Supplementary Data’’ of the 2009 Annual Report in Notes to Consolidated Financial Statements at Note 16, ‘‘Stock
Options and Stock Appreciation Rights.’’
(4) Except as provided below and in footnote (2) above, amounts in column (f) reflect the annual incentive awards earned for the 2009,
2008 and 2007 fiscal year performance periods, which were awarded by our Management Planning and Development Committee in
January 2010, January 2009 and January 2008, respectively, under the YUM Leaders’ Bonus Program, which is described further
beginning on page 33 under the heading ‘‘Performance-Based Annual Incentive Compensation’’. Under the Company’s EID Program
(which is described in more detail beginning on page 58), for 2008 and 2007 executives were permitted to defer their annual incentive
award and invest that deferral into stock units, RSUs or other investment alternatives offered under the program. Under the EID
Program, an executive who elected to defer his/her annual incentive award into RSUs received additional RSUs equal to 33% of the
RSUs acquired with the deferral of the annual incentive award (‘‘matching contribution’’). Pursuant to SEC rules, annual incentives
deferred into RSUs under the EID and subject to a risk of forfeiture are reported in column (d). If the deferral or a portion of the
deferral is not subject to a risk of forfeiture, it is reported in column (f).
For 2008 and 2007, Messrs. Novak and Su deferred 100% of their annual incentives into RSUs, and since each had attained age 55 with
10 years of service, as explained in footnote (2), they were fully vested in the deferral of their 2007 and 2008 annual incentive at the time
of their deferral and their annual incentives are reported in column (f).
For 2008 and 2007, Mr. Carucci elected to defer 56% and 70%, respectively, of his annual incentive into RSUs subject to a risk of
forfeiture.
For 2008, Mr. Allan deferred 100% of his annual incentive into RSUs resulting in nothing to report in column (f). Mr. Allan did not
defer his annual incentives into RSUs for 2007; therefore, the entire amount of these annual incentives are reported in column (f).
For 2008 and 2007, Mr. Creed elected to defer 100% of his annual incentive into RSUs, resulting in nothing to report in column (f).
Below is the 2008 and 2007 annual incentive awards for each NEO as approved by our Management Planning and Development
Committee. Also reported below is the amount of 2008 and 2007 annual incentive elected to be deferred by the executive and the
amount of matching contribution in the case of deferrals of the 2008 and 2007 annual incentive awards into RSUs.
Amount of 2008
Annual Incentive
Elected to
be Deferred
2008 Annual into the
Incentive Matching Matching
Name Award Stock Fund Contribution
Proxy Statement
Novak ............................................. 4,057,200 4,057,200 1,352,400
Carucci ............................................ 1,131,773 633,793 211,264
Su ............................................... 1,609,598 1,609,598 536,533
Allan ............................................. 1,965,206 1,965,206 655,069
Creed ............................................. 907,494 907,494 302,498
Amount of 2007
Annual Incentive
Elected to
be Deferred
2007 Annual into the
Incentive Matching Matching
Name Award Stock Fund Contribution
Novak ............................................. 4,742,892 4,742,892 1,580,964
Carucci ............................................ 1,263,780 884,646 294,882
Su ............................................... 1,719,900 1,719,900 573,300
Allan ............................................. 1,615,950 — —
Creed ............................................. 396,060 396,060 132,020
(5) Amounts in column (g) reflect the aggregate increase in actuarial present value of age 62 accrued benefits under all actuarial pension
plans during the 2009 fiscal year (using interest rate and mortality assumptions consistent with those used in the Company’s financial
statements). See the Pension Benefits Table at page 53 for a detailed discussion of the Company’s pension benefits. The Company does
not pay ‘‘above market’’ interest on non-qualified deferred compensation; therefore, this column reflects pension accruals only. For
Mr. Creed in 2007, the actuarial present value of his accrued benefit decreased $237; however, under SEC rules, the change is to be
reflected as a ‘‘0.’’
(6) Amounts in this column are explained in the All Other Compensation Table and footnotes to that table, which follows.
47