Pizza Hut 2009 Annual Report Download - page 200
Download and view the complete annual report
Please find page 200 of the 2009 Pizza Hut annual report below. You can navigate through the pages in the report by either clicking on the pages listed below, or by using the keyword search tool below to find specific information within the annual report.-
 1
1 -
2
-
3
-
4
-
5
-
6
-
7
-
8
-
9
-
10
-
11
-
12
-
13
-
14
-
15
-
16
-
17
-
18
-
19
-
20
-
21
-
22
-
23
-
24
-
25
-
26
-
27
-
28
-
29
-
30
-
31
-
32
-
33
-
34
-
35
-
36
-
37
-
38
-
39
-
40
-
41
-
42
-
43
-
44
-
45
-
46
-
47
-
48
-
49
-
50
-
51
-
52
-
53
-
54
-
55
-
56
-
57
-
58
-
59
-
60
-
61
-
62
-
63
-
64
-
65
-
66
-
67
-
68
-
69
-
70
-
71
-
72
-
73
-
74
-
75
-
76
-
77
-
78
-
79
-
80
-
81
-
82
-
83
-
84
-
85
-
86
-
87
-
88
-
89
-
90
-
91
-
92
-
93
-
94
-
95
-
96
-
97
-
98
-
99
-
100
-
101
-
102
-
103
-
104
-
105
-
106
-
107
-
108
-
109
-
110
-
111
-
112
-
113
-
114
-
115
-
116
-
117
-
118
-
119
-
120
-
121
-
122
-
123
-
124
-
125
-
126
-
127
-
128
-
129
-
130
-
131
-
132
-
133
-
134
-
135
-
136
-
137
-
138
-
139
-
140
-
141
-
142
-
143
-
144
-
145
-
146
-
147
-
148
-
149
-
150
-
151
-
152
-
153
-
154
-
155
-
156
-
157
-
158
-
159
-
160
-
161
-
162
-
163
-
164
-
165
-
166
-
167
-
168
-
169
-
170
-
171
-
172
-
173
-
174
-
175
-
176
-
177
-
178
-
179
-
180
-
181
-
182
-
183
-
184
-
185
-
186
-
187
-
188
-
189
-
 190
190 -
 191
191 -
 192
192 -
 193
193 -
 194
194 -
 195
195 -
 196
196 -
 197
197 -
 198
198 -
 199
199 -
 200
200 -
 201
201 -
 202
202 -
 203
203 -
 204
204 -
 205
205 -
 206
206 -
 207
207 -
 208
208 -
 209
209 -
 210
210 -
211
-
212
-
213
-
214
-
215
-
216
-
217
-
218
-
219
-
220
 |
 |

109
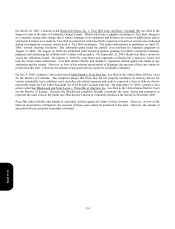
Franchise Loan Pool and Equipment Guarantees
We have provided a partial guarantee of approximately $15 million of a franchisee loan program used primarily to assist
franchisees in the development of new restaurants and, to a lesser extent, in connection with the Company’s historical
refranchising programs at December 26, 2009. We have also provided two letters of credit totaling approximately $23
million in support of the franchisee loan program. One such letter of credit could be used if we fail to meet our
obligations under our guarantee. The other letter of credit could be used, in certain circumstances, to fund our
participation in the funding of the franchisee loan program. The total loans outstanding under the loan pool were $54
million at December 26, 2009.
In addition to the guarantee described above, YUM has provided guarantees of $40 million on behalf of franchisees for
several equipment financing programs related to specific initiatives, the most significant of which was the purchase of
ovens by KFC franchisees for the launch of Kentucky Grilled Chicken. We have provided a letter of credit totaling $5
million which could be used if we fail to meet our obligations under our guarantee under one equipment financing
program. The total loans outstanding under these equipment financing programs were approximately $48 million at
December 26, 2009.
Unconsolidated Affiliates Guarantees
From time to time we have guaranteed certain lines of credit and loans of unconsolidated affiliates. At December 26,
2009 there are no guarantees outstanding for unconsolidated affiliates. Our unconsolidated affiliates had total revenues of
approximately $760 million for the year ended December 26, 2009 and assets and debt of approximately $365 million and
$40 million, respectively, at December 26, 2009.
Insurance Programs
We are self-insured for a substantial portion of our current and prior years’ coverage including workers’ compensation,
employment practices liability, general liability, automobile liability, product liability and property losses (collectively,
“property and casualty losses”). To mitigate the cost of our exposures for certain property and casualty losses, we make
annual decisions to self-insure the risks of loss up to defined maximum per occurrence retentions on a line by line basis or
to combine certain lines of coverage into one loss pool with a single self-insured aggregate retention. The Company then
purchases insurance coverage, up to a certain limit, for losses that exceed the self-insurance per occurrence or aggregate
retention. The insurers’ maximum aggregate loss limits are significantly above our actuarially determined probable
losses; therefore, we believe the likelihood of losses exceeding the insurers’ maximum aggregate loss limits is remote.
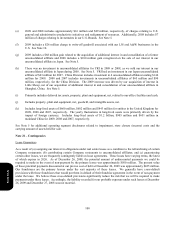
The following table summarizes the 2009 and 2008 activity related to our self-insured property and casualty reserves as of
December 26, 2009. The decrease in 2009 insurance expense primarily was driven by U.S. refranchising and improved
loss trends.
Beginning
Balance Expense Payments
Ending
Balance
2009 Activit
y
$ 196 44
(
67
)
$ 173
2008 Activity $ 197 68 (69
)
$ 196
In the U.S. and in certain other countries, we are also self-insured for healthcare claims and long-term disability for
eligible participating employees subject to certain deductibles and limitations. We have accounted for our retained
liabilities for property and casualty losses, healthcare and long-term disability claims, including reported and incurred but
not reported claims, based on information provided by independent actuaries.
Form 10-K