Pizza Hut 2009 Annual Report Download - page 194
Download and view the complete annual report
Please find page 194 of the 2009 Pizza Hut annual report below. You can navigate through the pages in the report by either clicking on the pages listed below, or by using the keyword search tool below to find specific information within the annual report.-
 1
1 -
2
-
3
-
4
-
5
-
6
-
7
-
8
-
9
-
10
-
11
-
12
-
13
-
14
-
15
-
16
-
17
-
18
-
19
-
20
-
21
-
22
-
23
-
24
-
25
-
26
-
27
-
28
-
29
-
30
-
31
-
32
-
33
-
34
-
35
-
36
-
37
-
38
-
39
-
40
-
41
-
42
-
43
-
44
-
45
-
46
-
47
-
48
-
49
-
50
-
51
-
52
-
53
-
54
-
55
-
56
-
57
-
58
-
59
-
60
-
61
-
62
-
63
-
64
-
65
-
66
-
67
-
68
-
69
-
70
-
71
-
72
-
73
-
74
-
75
-
76
-
77
-
78
-
79
-
80
-
81
-
82
-
83
-
84
-
85
-
86
-
87
-
88
-
89
-
90
-
91
-
92
-
93
-
94
-
95
-
96
-
97
-
98
-
99
-
100
-
101
-
102
-
103
-
104
-
105
-
106
-
107
-
108
-
109
-
110
-
111
-
112
-
113
-
114
-
115
-
116
-
117
-
118
-
119
-
120
-
121
-
122
-
123
-
124
-
125
-
126
-
127
-
128
-
129
-
130
-
131
-
132
-
133
-
134
-
135
-
136
-
137
-
138
-
139
-
140
-
141
-
142
-
143
-
144
-
145
-
146
-
147
-
148
-
149
-
150
-
151
-
152
-
153
-
154
-
155
-
156
-
157
-
158
-
159
-
160
-
161
-
162
-
163
-
164
-
165
-
166
-
167
-
168
-
169
-
170
-
171
-
172
-
173
-
174
-
175
-
176
-
177
-
178
-
179
-
180
-
181
-
182
-
183
-
 184
184 -
 185
185 -
 186
186 -
 187
187 -
 188
188 -
 189
189 -
 190
190 -
 191
191 -
 192
192 -
 193
193 -
 194
194 -
 195
195 -
 196
196 -
 197
197 -
 198
198 -
 199
199 -
 200
200 -
 201
201 -
 202
202 -
 203
203 -
 204
204 -
205
-
206
-
207
-
208
-
209
-
210
-
211
-
212
-
213
-
214
-
215
-
216
-
217
-
218
-
219
-
220
 |
 |

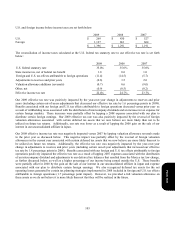
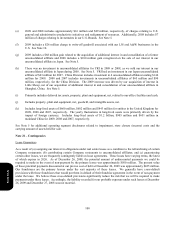
103
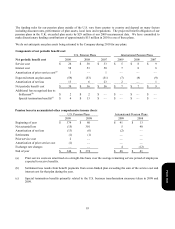
U.S. and foreign income before income taxes are set forth below:
2009 2008 2007
U.S.
$
269 $ 430 $ 527
Forei
g
n 1
,
127 861 664
$
1
,
396 $ 1
,
291 $ 1
,
191
The reconciliation of income taxes calculated at the U.S. federal tax statutory rate to our effective tax rate is set forth
below:
2009 2008 2007
U.S. federal statutory rate 35.0
%
35.0% 35.0%
State income tax, net of federal tax benefit 1.0 0.6 1.0
Foreign and U.S. tax effects attributable to foreign operations (11.4
)
(14.5) (5.7)
Adjustments to reserves and prior years (0.6
)
3.5 2.6
Valuation allowance additions (reversals) (0.7 ) 0.6 (9.0)
Other, net (0.9
)
(0.5) (0.2)
Effective income tax rate 22.4
%
24.7% 23.7%
Our 2009 effective tax rate was positively impacted by the year-over-year change in adjustments to reserves and prior
years (including certain out-of-years adjustments that decreased our effective tax rate by 1.6 percentage points in 2009).
Benefits associated with our foreign and U.S. tax effects attributable to foreign operations decreased versus prior year as
a result of withholding taxes associated with the distribution of intercompany dividends and an increase in tax expense for
certain foreign markets. These increases were partially offset by lapping a 2008 expense associated with our plan to
distribute certain foreign earnings. Our 2009 effective tax rate was also positively impacted by the reversal of foreign
valuation allowances associated with certain deferred tax assets that we now believe are more likely than not to be
utilized on future tax returns. Additionally, our rate was lower as a result of lapping the 2008 gain on the sale of our
interest in our unconsolidated affiliate in Japan.
Our 2008 effective income tax rate was negatively impacted versus 2007 by lapping valuation allowance reversals made
in the prior year as discussed below. This negative impact was partially offset by the reversal of foreign valuation
allowances in the current year associated with certain deferred tax assets that we now believe are more likely than not to
be utilized on future tax returns. Additionally, the effective tax rate was negatively impacted by the year-over-year
change in adjustments to reserves and prior years (including certain out-of-year adjustments that increased our effective
tax rate by 1.8 percentage points in 2008). Benefits associated with our foreign and U.S. tax effects attributable to foreign
operations positively impacted the effective tax rate as a result of lapping 2007 expenses associated with the distribution
of an intercompany dividend and adjustments to our deferred tax balances that resulted from the Mexico tax law change,
as further discussed below, as well as a higher percentage of our income being earned outside the U.S. These benefits
were partially offset in 2008 by the gain on the sale of our interest in our unconsolidated affiliate in Japan and expense
associated with our plan to distribute certain foreign earnings. We also recognized deferred tax assets for the net
operating losses generated by certain tax planning strategies implemented in 2008 included in foreign and U.S. tax effects
attributable to foreign operations (1.7 percentage point impact). However, we provided a full valuation allowance on
these assets as we do not believe it is more likely than not that they will be realized in the future.
Form 10-K