Pizza Hut 2009 Annual Report Download - page 139
Download and view the complete annual report
Please find page 139 of the 2009 Pizza Hut annual report below. You can navigate through the pages in the report by either clicking on the pages listed below, or by using the keyword search tool below to find specific information within the annual report.-
 1
1 -
2
-
3
-
4
-
5
-
6
-
7
-
8
-
9
-
10
-
11
-
12
-
13
-
14
-
15
-
16
-
17
-
18
-
19
-
20
-
21
-
22
-
23
-
24
-
25
-
26
-
27
-
28
-
29
-
30
-
31
-
32
-
33
-
34
-
35
-
36
-
37
-
38
-
39
-
40
-
41
-
42
-
43
-
44
-
45
-
46
-
47
-
48
-
49
-
50
-
51
-
52
-
53
-
54
-
55
-
56
-
57
-
58
-
59
-
60
-
61
-
62
-
63
-
64
-
65
-
66
-
67
-
68
-
69
-
70
-
71
-
72
-
73
-
74
-
75
-
76
-
77
-
78
-
79
-
80
-
81
-
82
-
83
-
84
-
85
-
86
-
87
-
88
-
89
-
90
-
91
-
92
-
93
-
94
-
95
-
96
-
97
-
98
-
99
-
100
-
101
-
102
-
103
-
104
-
105
-
106
-
107
-
108
-
109
-
110
-
111
-
112
-
113
-
114
-
115
-
116
-
117
-
118
-
119
-
120
-
121
-
122
-
123
-
124
-
125
-
126
-
127
-
128
-
 129
129 -
 130
130 -
 131
131 -
 132
132 -
 133
133 -
 134
134 -
 135
135 -
 136
136 -
 137
137 -
 138
138 -
 139
139 -
 140
140 -
 141
141 -
 142
142 -
 143
143 -
 144
144 -
 145
145 -
 146
146 -
 147
147 -
 148
148 -
 149
149 -
150
-
151
-
152
-
153
-
154
-
155
-
156
-
157
-
158
-
159
-
160
-
161
-
162
-
163
-
164
-
165
-
166
-
167
-
168
-
169
-
170
-
171
-
172
-
173
-
174
-
175
-
176
-
177
-
178
-
179
-
180
-
181
-
182
-
183
-
184
-
185
-
186
-
187
-
188
-
189
-
190
-
191
-
192
-
193
-
194
-
195
-
196
-
197
-
198
-
199
-
200
-
201
-
202
-
203
-
204
-
205
-
206
-
207
-
208
-
209
-
210
-
211
-
212
-
213
-
214
-
215
-
216
-
217
-
218
-
219
-
220
 |
 |

48
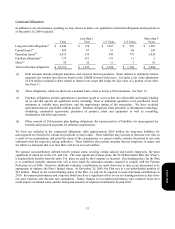
Adjustments to reserves and prior years include the effects of the reconciliation of income tax amounts recorded in our
Consolidated Statements of Income to amounts reflected on our tax returns, including any adjustments to the Consolidated
Balance Sheets. Adjustments to reserves and prior years also includes changes in tax reserves, including interest thereon,
established for potential exposure we may incur if a taxing authority takes a position on a matter contrary to our position.
We evaluate these reserves on a quarterly basis to ensure that they have been appropriately adjusted for events, including
audit settlements that we believe may impact our exposure.
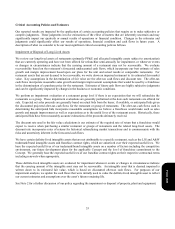
Consolidated Cash Flows
Net cash provided by operating activities was $1,404 million compared to $1,521 million in 2008. The decrease was
primarily driven by higher pension contributions, partially offset by higher net income.
In 2008, net cash provided by operating activities was $1,521 million compared to $1,551 million in 2007. The decrease
was primarily driven by higher interest payments and pension contributions.
Net cash used in investing activities was $727 million versus $641 million in 2008. The increase was driven by the
acquisition of an interest in Little Sheep, as discussed in Note 5, lower proceeds from refranchising and sales of property,
plant and equipment, partially offset by lower capital spending.
In 2008, net cash used in investing activities was $641 million versus $416 million in 2007. The increase was driven by
higher capital spending in 2008 and the lapping of proceeds from the sale of our interest in the Japan unconsolidated
affiliate in 2007, partially offset by the year-over-year change in proceeds from refranchising of restaurants.
In December 2007, we sold our interest in our unconsolidated affiliate in Japan for $128 million (includes the impact of
related foreign currency contracts that were settled in December 2007). The international subsidiary that owned this
interest operates on a fiscal calendar with a period end that is approximately one month earlier than our consolidated
period close. Thus, consistent with our historical treatment of events occurring during the lag period, the pre-tax gain on
the sale of this investment of $100 million was recorded in the first quarter of 2008. However, the cash proceeds from
this transaction were transferred from our international subsidiary to the U.S. in December 2007 and were thus reported
on our Consolidated Statement of Cash Flows for the year ended December 29, 2007.
Net cash used in financing activities was $542 million versus $1,459 million in 2008. The decrease was driven by a
reduction in share repurchases, partially offset by net payments on debt.
In 2008, net cash used in financing activities was $1,459 million versus $678 million in 2007. The increase was driven by
lower net borrowings, higher share repurchases and higher dividend payments in 2008.
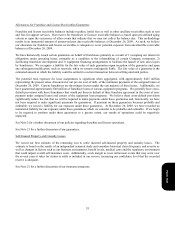
Consolidated Financial Condition
The acquisition of additional ownership in, and consolidation of, a former unconsolidated affiliate that operates the KFCs
in Shanghai, China during 2009 impacted our Consolidated Balance Sheet at December 26, 2009. See Note 5 for a
discussion of this transaction and a summary of the assets acquired and liabilities assumed as a result of the acquisition
and consolidation.
Form 10-K