Pizza Hut 2009 Annual Report Download - page 185
Download and view the complete annual report
Please find page 185 of the 2009 Pizza Hut annual report below. You can navigate through the pages in the report by either clicking on the pages listed below, or by using the keyword search tool below to find specific information within the annual report.-
 1
1 -
2
-
3
-
4
-
5
-
6
-
7
-
8
-
9
-
10
-
11
-
12
-
13
-
14
-
15
-
16
-
17
-
18
-
19
-
20
-
21
-
22
-
23
-
24
-
25
-
26
-
27
-
28
-
29
-
30
-
31
-
32
-
33
-
34
-
35
-
36
-
37
-
38
-
39
-
40
-
41
-
42
-
43
-
44
-
45
-
46
-
47
-
48
-
49
-
50
-
51
-
52
-
53
-
54
-
55
-
56
-
57
-
58
-
59
-
60
-
61
-
62
-
63
-
64
-
65
-
66
-
67
-
68
-
69
-
70
-
71
-
72
-
73
-
74
-
75
-
76
-
77
-
78
-
79
-
80
-
81
-
82
-
83
-
84
-
85
-
86
-
87
-
88
-
89
-
90
-
91
-
92
-
93
-
94
-
95
-
96
-
97
-
98
-
99
-
100
-
101
-
102
-
103
-
104
-
105
-
106
-
107
-
108
-
109
-
110
-
111
-
112
-
113
-
114
-
115
-
116
-
117
-
118
-
119
-
120
-
121
-
122
-
123
-
124
-
125
-
126
-
127
-
128
-
129
-
130
-
131
-
132
-
133
-
134
-
135
-
136
-
137
-
138
-
139
-
140
-
141
-
142
-
143
-
144
-
145
-
146
-
147
-
148
-
149
-
150
-
151
-
152
-
153
-
154
-
155
-
156
-
157
-
158
-
159
-
160
-
161
-
162
-
163
-
164
-
165
-
166
-
167
-
168
-
169
-
170
-
171
-
172
-
173
-
174
-
 175
175 -
 176
176 -
 177
177 -
 178
178 -
 179
179 -
 180
180 -
 181
181 -
 182
182 -
 183
183 -
 184
184 -
 185
185 -
 186
186 -
 187
187 -
 188
188 -
 189
189 -
 190
190 -
 191
191 -
 192
192 -
 193
193 -
 194
194 -
 195
195 -
196
-
197
-
198
-
199
-
200
-
201
-
202
-
203
-
204
-
205
-
206
-
207
-
208
-
209
-
210
-
211
-
212
-
213
-
214
-
215
-
216
-
217
-
218
-
219
-
220
 |
 |

94
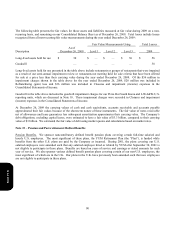
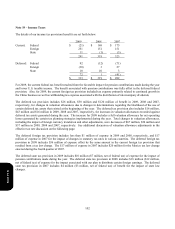
The estimated net loss for the U.S. and International pension plans that will be amortized from accumulated other
comprehensive loss into net periodic pension cost in 2010 is $23 million and $2 million, respectively. The estimated prior
service cost for the U.S. pension plans that will be amortized from accumulated other comprehensive loss into net periodic
pension cost in 2010 is $1 million.
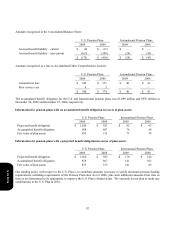
Weighted-average assumptions used to determine benefit obligations at the measurement dates:
U.S. Pension Plans International Pension Plans
2009 2008 2009 2008
Discount rate 6.30% 6.50% 5.50% 5.50%
Rate of compensation increase 3.75% 3.75% 4.41% 4.10%
W
eighted-average assumptions used to determine the net periodic benefit cost for fiscal years:
U.S. Pension Plans International Pension Plans
2009 2008 2007 2009 2008 2007
Discount rate 6.50% 6.50% 5.95% 5.50% 5.60% 5.00%
Long-term rate of return on plan
assets 8.00% 8.00% 8.00% 7.20% 7.28% 7.07%
Rate of compensation increase 3.75% 3.75% 3.75% 4.11% 4.30% 3.78%
Our estimated long-term rate of return on plan assets represents the weighted-average of expected future returns on the
asset categories included in our target investment allocation based primarily on the historical returns for each asset
category, adjusted for an assessment of current market conditions.
Form 10-K