Pizza Hut 2009 Annual Report Download - page 186
Download and view the complete annual report
Please find page 186 of the 2009 Pizza Hut annual report below. You can navigate through the pages in the report by either clicking on the pages listed below, or by using the keyword search tool below to find specific information within the annual report.-
 1
1 -
2
-
3
-
4
-
5
-
6
-
7
-
8
-
9
-
10
-
11
-
12
-
13
-
14
-
15
-
16
-
17
-
18
-
19
-
20
-
21
-
22
-
23
-
24
-
25
-
26
-
27
-
28
-
29
-
30
-
31
-
32
-
33
-
34
-
35
-
36
-
37
-
38
-
39
-
40
-
41
-
42
-
43
-
44
-
45
-
46
-
47
-
48
-
49
-
50
-
51
-
52
-
53
-
54
-
55
-
56
-
57
-
58
-
59
-
60
-
61
-
62
-
63
-
64
-
65
-
66
-
67
-
68
-
69
-
70
-
71
-
72
-
73
-
74
-
75
-
76
-
77
-
78
-
79
-
80
-
81
-
82
-
83
-
84
-
85
-
86
-
87
-
88
-
89
-
90
-
91
-
92
-
93
-
94
-
95
-
96
-
97
-
98
-
99
-
100
-
101
-
102
-
103
-
104
-
105
-
106
-
107
-
108
-
109
-
110
-
111
-
112
-
113
-
114
-
115
-
116
-
117
-
118
-
119
-
120
-
121
-
122
-
123
-
124
-
125
-
126
-
127
-
128
-
129
-
130
-
131
-
132
-
133
-
134
-
135
-
136
-
137
-
138
-
139
-
140
-
141
-
142
-
143
-
144
-
145
-
146
-
147
-
148
-
149
-
150
-
151
-
152
-
153
-
154
-
155
-
156
-
157
-
158
-
159
-
160
-
161
-
162
-
163
-
164
-
165
-
166
-
167
-
168
-
169
-
170
-
171
-
172
-
173
-
174
-
175
-
 176
176 -
 177
177 -
 178
178 -
 179
179 -
 180
180 -
 181
181 -
 182
182 -
 183
183 -
 184
184 -
 185
185 -
 186
186 -
 187
187 -
 188
188 -
 189
189 -
 190
190 -
 191
191 -
 192
192 -
 193
193 -
 194
194 -
 195
195 -
 196
196 -
197
-
198
-
199
-
200
-
201
-
202
-
203
-
204
-
205
-
206
-
207
-
208
-
209
-
210
-
211
-
212
-
213
-
214
-
215
-
216
-
217
-
218
-
219
-
220
 |
 |

95
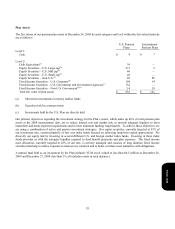
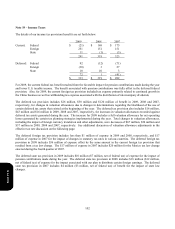
Plan Assets
The fair values of our pension plan assets at December 26, 2009 by asset category and level within the fair value hierarchy
are as follows:
U.S. Pension
Plans
International
Pension Plans
Level 1:
Cash $ 4 $ 7
Level 2:
Cash Equivalents(a) 39 —
Equity Securities – U.S. Large cap(b) 271 5
Equity Securities – U.S. Mid cap(b) 46 —
Equity Securities – U.S. Small cap(b) 46 —
Equity Securities – Non-U.S.(b) 89 96
Fixed Income Securities – U.S. Corporate(b) 194 14
Fixed Income Securities – U.S. Government and Government Agencies(c) 132 —
Fixed Income Securities – Non-U.S. Government(b)(c) 14 19
Total fair value of plan assets $ 835 $ 141
(a) Short-term investments in money market funds
(b) Securities held in common trusts
(c)
I
nvestments held by the U.S. Plan are directly held
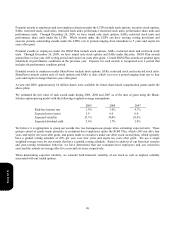
Our primary objectives regarding the investment strategy for the Plan’s assets, which make up 86% of total pension plan
assets at the 2009 measurement date, are to reduce interest rate and market risk, to provide adequate liquidity to meet
immediate and future payment requirements and to meet minimum funding requirements. To achieve these objectives, we
are using a combination of active and passive investment strategies. Our equity securities, currently targeted at 55% of
our investment mix, consist primarily of low cost index funds focused on achieving long-term capital appreciation. We
diversify our equity risk by investing in several different U.S. and foreign market index funds. Investing in these index
funds provides us with the adequate liquidity required to fund benefit payments and plan expenses. The fixed income
asset allocation, currently targeted at 45% of our mix, is actively managed and consists of long duration fixed income
securities that help to reduce exposure to interest rate variation and to better correlate asset maturities with obligations.
A mutual fund held as an investment by the Plan includes YUM stock valued at less than $0.5 million at December 26,
2009 and December 27, 2008 (less than 1% of total plan assets in each instance).
Form 10-K