Pizza Hut 2009 Annual Report Download - page 153
Download and view the complete annual report
Please find page 153 of the 2009 Pizza Hut annual report below. You can navigate through the pages in the report by either clicking on the pages listed below, or by using the keyword search tool below to find specific information within the annual report.-
 1
1 -
2
-
3
-
4
-
5
-
6
-
7
-
8
-
9
-
10
-
11
-
12
-
13
-
14
-
15
-
16
-
17
-
18
-
19
-
20
-
21
-
22
-
23
-
24
-
25
-
26
-
27
-
28
-
29
-
30
-
31
-
32
-
33
-
34
-
35
-
36
-
37
-
38
-
39
-
40
-
41
-
42
-
43
-
44
-
45
-
46
-
47
-
48
-
49
-
50
-
51
-
52
-
53
-
54
-
55
-
56
-
57
-
58
-
59
-
60
-
61
-
62
-
63
-
64
-
65
-
66
-
67
-
68
-
69
-
70
-
71
-
72
-
73
-
74
-
75
-
76
-
77
-
78
-
79
-
80
-
81
-
82
-
83
-
84
-
85
-
86
-
87
-
88
-
89
-
90
-
91
-
92
-
93
-
94
-
95
-
96
-
97
-
98
-
99
-
100
-
101
-
102
-
103
-
104
-
105
-
106
-
107
-
108
-
109
-
110
-
111
-
112
-
113
-
114
-
115
-
116
-
117
-
118
-
119
-
120
-
121
-
122
-
123
-
124
-
125
-
126
-
127
-
128
-
129
-
130
-
131
-
132
-
133
-
134
-
135
-
136
-
137
-
138
-
139
-
140
-
141
-
142
-
 143
143 -
 144
144 -
 145
145 -
 146
146 -
 147
147 -
 148
148 -
 149
149 -
 150
150 -
 151
151 -
 152
152 -
 153
153 -
 154
154 -
 155
155 -
 156
156 -
 157
157 -
 158
158 -
 159
159 -
 160
160 -
 161
161 -
 162
162 -
 163
163 -
164
-
165
-
166
-
167
-
168
-
169
-
170
-
171
-
172
-
173
-
174
-
175
-
176
-
177
-
178
-
179
-
180
-
181
-
182
-
183
-
184
-
185
-
186
-
187
-
188
-
189
-
190
-
191
-
192
-
193
-
194
-
195
-
196
-
197
-
198
-
199
-
200
-
201
-
202
-
203
-
204
-
205
-
206
-
207
-
208
-
209
-
210
-
211
-
212
-
213
-
214
-
215
-
216
-
217
-
218
-
219
-
220
 |
 |

62
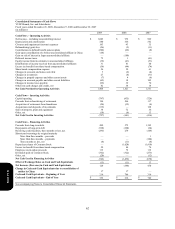
Consolidated Statements of Cash Flows
YUM! Brands, Inc. and Subsidiaries
Fiscal years ended December 26, 2009, December 27, 2008 and December 29, 2007
(in millions)
2009 2008 2007
Cash Flows – Operating Activities
N
et Income – including noncontrolling interest $ 1,083 $ 972 $ 909
Depreciation and amortization 580 556 542
Closures and impairment (income) expenses 103 43 35
Refranchising (gain) loss (26 ) (5 ) (11 )
Contributions to defined benefit pension plans (280 ) (66 ) (8 )
Gain upon consolidation of a former unconsolidated affiliate in China (68 ) —
—
Gain on sale of interest in Japan unconsolidated affiliate — (100 )
—
Deferred income taxes 72 1 (41 )
Equity income from investments in unconsolidated affiliates (36 ) (41 ) (51 )
Distributions of income received from unconsolidated affiliates 31 41 40
Excess tax benefit from share-based compensation (59 ) (44 ) (74 )
Share-based compensation expense 56 59 61
Changes in accounts and notes receivable 3 (6 ) (4 )
Changes in inventories 27 (8 ) (31 )
Changes in prepaid expenses and other current assets (7 ) 4 (6 )
Changes in accounts payable and other current liabilities (62 ) 18 102
Changes in income taxes payable (95 ) 39 70
Other non-cash charges and credits, net 82 58 18
Net Cash Provided by Operating Activities 1,404 1,521 1,551
Cash Flows – Investing Activities
Capital spending (797 ) (935 ) (726 )
Proceeds from refranchising of restaurants 194 266 117
Acquisition of restaurants from franchisees (24 ) (35 ) (4 )
Acquisitions and disposals of investments (115 ) — 128
Sales of property, plant and equipment 34 72 56
Other, net (19 ) (9 ) 13
Net Cash Used in Investing Activities (727 ) (641 ) (416 )
Cash Flows – Financing Activities
Proceeds from long-term debt 499 375 1,195
Repayments of long-term debt (528 ) (268 ) (24 )
Revolving credit facilities, three months or less, net (295 ) 279 (149 )
Short-term borrowings by original maturity
More than three months – proceeds — — 1
More than three months – payments — — (184 )
Three months or less, net (8 ) (11 ) (8 )
Repurchase shares of Common Stock — (1,628 ) (1,410 )
Excess tax benefit from share-based compensation 59 44 74
Employee stock option proceeds 113 72 112
Dividends paid on Common Stock (362 ) (322 ) (273 )
Other, net (20 ) — (12 )
Net Cash Used in Financing Activities (542 ) (1,459 ) (678 )
Effect of Exchange Rates on Cash and Cash Equivalents (15 ) (11 ) 13
Net Increase (Decrease) in Cash and Cash Equivalents 120 (590 ) 470
Change in Cash and Cash Equivalents due to consolidation of
entities in China
17 17 —
Cash and Cash Equivalents – Beginning of Year 216 789 319
Cash and Cash Equivalents – End of Year $ 353 $ 216 $ 789
See accompanying Notes to Consolidated Financial Statements.
Form 10-K