Pizza Hut 2009 Annual Report Download - page 68
Download and view the complete annual report
Please find page 68 of the 2009 Pizza Hut annual report below. You can navigate through the pages in the report by either clicking on the pages listed below, or by using the keyword search tool below to find specific information within the annual report.-
 1
1 -
2
-
3
-
4
-
5
-
6
-
7
-
8
-
9
-
10
-
11
-
12
-
13
-
14
-
15
-
16
-
17
-
18
-
19
-
20
-
21
-
22
-
23
-
24
-
25
-
26
-
27
-
28
-
29
-
30
-
31
-
32
-
33
-
34
-
35
-
36
-
37
-
38
-
39
-
40
-
41
-
42
-
43
-
44
-
45
-
46
-
47
-
48
-
49
-
50
-
51
-
52
-
53
-
54
-
55
-
56
-
57
-
 58
58 -
 59
59 -
 60
60 -
 61
61 -
 62
62 -
 63
63 -
 64
64 -
 65
65 -
 66
66 -
 67
67 -
 68
68 -
 69
69 -
 70
70 -
 71
71 -
 72
72 -
 73
73 -
 74
74 -
 75
75 -
 76
76 -
 77
77 -
 78
78 -
79
-
80
-
81
-
82
-
83
-
84
-
85
-
86
-
87
-
88
-
89
-
90
-
91
-
92
-
93
-
94
-
95
-
96
-
97
-
98
-
99
-
100
-
101
-
102
-
103
-
104
-
105
-
106
-
107
-
108
-
109
-
110
-
111
-
112
-
113
-
114
-
115
-
116
-
117
-
118
-
119
-
120
-
121
-
122
-
123
-
124
-
125
-
126
-
127
-
128
-
129
-
130
-
131
-
132
-
133
-
134
-
135
-
136
-
137
-
138
-
139
-
140
-
141
-
142
-
143
-
144
-
145
-
146
-
147
-
148
-
149
-
150
-
151
-
152
-
153
-
154
-
155
-
156
-
157
-
158
-
159
-
160
-
161
-
162
-
163
-
164
-
165
-
166
-
167
-
168
-
169
-
170
-
171
-
172
-
173
-
174
-
175
-
176
-
177
-
178
-
179
-
180
-
181
-
182
-
183
-
184
-
185
-
186
-
187
-
188
-
189
-
190
-
191
-
192
-
193
-
194
-
195
-
196
-
197
-
198
-
199
-
200
-
201
-
202
-
203
-
204
-
205
-
206
-
207
-
208
-
209
-
210
-
211
-
212
-
213
-
214
-
215
-
216
-
217
-
218
-
219
-
220
 |
 |

21MAR201012032
Proxy Statement
49
GRANTS OF PLAN-BASED AWARDS
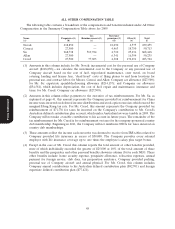
The following table provides information on stock options, SARs, RSUs and PSUs granted for 2009 to each of the Company’s NEOs. The
amount of these awards that were expensed is shown in the Summary Compensation Table at page 46.
All Other
Option/SAR
Awards: Exercise or
Number of Base Price
Estimated Possible Payouts Under Estimated Future Payouts Under Securities of
Non-Equity Incentive Plan Awards(1) Equity Incentive Plan Awards(2) Underlying Option/SAR Grant Date
Name and Threshold Target Maximum Threshold Target Maximum Options Awards Fair Value
Principal Position Grant Date ($) ($) ($) (#) (#) (#) (#)(3) ($/Sh)(4) ($)(5)
(a) (b) (c) (d) (e) (f) (g) (h) (i) (j) (k)
Novak 2/5/2009 0 2,240,000 6,720,000
2/5/2009 575,102 29.29 4,192,111
3/27/2009 0 25,703 51,406 739,989
Carucci 2/5/2009 0 679,250 2,037,750
2/5/2009 202,977 29.29 1,479,567
3/27/2009 0 7,815 15,630 224,994
Su 2/5/2009 0 937,250 2,811,750
2/5/2009 202,977 29.29 1,479,567
3/27/2009 0 10,768 21,536 310,011
Allan 2/5/2009 0 937,250 2,811,750
2/5/2009 202,977 29.29 1,479,567
3/27/2009 0 10,768 21,536 310,011
Creed 2/5/2009 0 585,000 1,755,000
2/5/2009 169,148 29.29 1,232,976
3/27/2009 0 6,773 13,546 194,995
(1) Amounts in columns (c), (d) and (e) provide the minimum amount, target amount and maximum amounts payable as annual incentive
compensation under the YUM Leaders’ Bonus Program based on the Company’s performance and on each executive’s individual
performance during 2009. The actual amount of annual incentive compensation awarded for 2009 is shown in column (f) of the Summary
Compensation Table on page 46. The performance measurements, performance targets, and target bonus percentage are described in the
Compensation Discussion and Analysis beginning on page 33 under the discussion of annual incentive compensation.