Pizza Hut 2009 Annual Report Download - page 129
Download and view the complete annual report
Please find page 129 of the 2009 Pizza Hut annual report below. You can navigate through the pages in the report by either clicking on the pages listed below, or by using the keyword search tool below to find specific information within the annual report.-
 1
1 -
2
-
3
-
4
-
5
-
6
-
7
-
8
-
9
-
10
-
11
-
12
-
13
-
14
-
15
-
16
-
17
-
18
-
19
-
20
-
21
-
22
-
23
-
24
-
25
-
26
-
27
-
28
-
29
-
30
-
31
-
32
-
33
-
34
-
35
-
36
-
37
-
38
-
39
-
40
-
41
-
42
-
43
-
44
-
45
-
46
-
47
-
48
-
49
-
50
-
51
-
52
-
53
-
54
-
55
-
56
-
57
-
58
-
59
-
60
-
61
-
62
-
63
-
64
-
65
-
66
-
67
-
68
-
69
-
70
-
71
-
72
-
73
-
74
-
75
-
76
-
77
-
78
-
79
-
80
-
81
-
82
-
83
-
84
-
85
-
86
-
87
-
88
-
89
-
90
-
91
-
92
-
93
-
94
-
95
-
96
-
97
-
98
-
99
-
100
-
101
-
102
-
103
-
104
-
105
-
106
-
107
-
108
-
109
-
110
-
111
-
112
-
113
-
114
-
115
-
116
-
117
-
118
-
 119
119 -
 120
120 -
 121
121 -
 122
122 -
 123
123 -
 124
124 -
 125
125 -
 126
126 -
 127
127 -
 128
128 -
 129
129 -
 130
130 -
 131
131 -
 132
132 -
 133
133 -
 134
134 -
 135
135 -
 136
136 -
 137
137 -
 138
138 -
 139
139 -
140
-
141
-
142
-
143
-
144
-
145
-
146
-
147
-
148
-
149
-
150
-
151
-
152
-
153
-
154
-
155
-
156
-
157
-
158
-
159
-
160
-
161
-
162
-
163
-
164
-
165
-
166
-
167
-
168
-
169
-
170
-
171
-
172
-
173
-
174
-
175
-
176
-
177
-
178
-
179
-
180
-
181
-
182
-
183
-
184
-
185
-
186
-
187
-
188
-
189
-
190
-
191
-
192
-
193
-
194
-
195
-
196
-
197
-
198
-
199
-
200
-
201
-
202
-
203
-
204
-
205
-
206
-
207
-
208
-
209
-
210
-
211
-
212
-
213
-
214
-
215
-
216
-
217
-
218
-
219
-
220
 |
 |

38
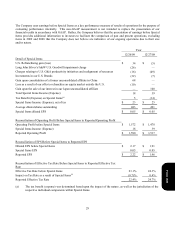
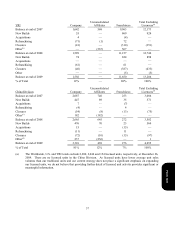
(b) In our fiscal quarter ended March 22, 2008, we sold our interest in our unconsolidated affiliate in Japan. While
we will no longer have an ownership interest in the entity that operates both KFCs and Pizza Huts in Japan, it
will continue to be a franchisee as it was when it operated as an unconsolidated affiliate. See Note 5.
(c) On January 1, 2008, we began consolidating an entity in China in which we have a majority ownership interest.
This entity was previously accounted for as an unconsolidated affiliate and we reclassified the units accordingly.
See Note 5.
(d) During the second quarter of 2009 we acquired additional ownership in and began consolidating an entity that
operates the KFC business in Shanghai, China and have reclassified the units accordingly. This entity was
p
reviously accounted for as an unconsolidated affiliate.
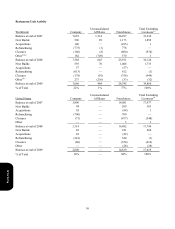
Multibrand restaurants are included in the totals above. Multibrand conversions increase the sales and points of
distribution for the second brand added to a restaurant but do not result in an additional unit count. Similarly, a new
multibrand restaurant, while increasing sales and points of distribution for two brands, results in just one additional unit
count.
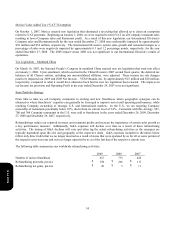
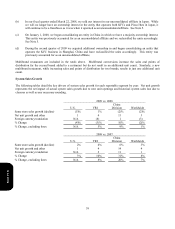
System Sales Growth
The following tables detail the key drivers of system sales growth for each reportable segment by year. Net unit growth
represents the net impact of actual system sales growth due to new unit openings and historical system sales lost due to
closures as well as any necessary rounding.
2009 vs. 2008
U.S. YRI
China
Division Worldwide
Same store sales growth (decline) (5) % 1% (2) % (2)%
N
et unit growth and other 1 4 11 3
Foreign currency translation N/A (8) 1 (3)
% Change (4) % (3)% 10 % (2)%
% Change, excluding forex N/A 5% 9 % 1%
2008 vs. 2007
U.S. YRI
China
Division Worldwide
Same store sales growth (decline) 2% 4% 6 % 3%
N
et unit growth and other 1 4 14 4
Foreign currency translation N/A 2 11 1
% Change 3% 10% 31 % 8%
% Change, excluding forex N/A 8% 20 % 7%
Form 10-K