Pizza Hut 2009 Annual Report Download - page 136
Download and view the complete annual report
Please find page 136 of the 2009 Pizza Hut annual report below. You can navigate through the pages in the report by either clicking on the pages listed below, or by using the keyword search tool below to find specific information within the annual report.-
 1
1 -
2
-
3
-
4
-
5
-
6
-
7
-
8
-
9
-
10
-
11
-
12
-
13
-
14
-
15
-
16
-
17
-
18
-
19
-
20
-
21
-
22
-
23
-
24
-
25
-
26
-
27
-
28
-
29
-
30
-
31
-
32
-
33
-
34
-
35
-
36
-
37
-
38
-
39
-
40
-
41
-
42
-
43
-
44
-
45
-
46
-
47
-
48
-
49
-
50
-
51
-
52
-
53
-
54
-
55
-
56
-
57
-
58
-
59
-
60
-
61
-
62
-
63
-
64
-
65
-
66
-
67
-
68
-
69
-
70
-
71
-
72
-
73
-
74
-
75
-
76
-
77
-
78
-
79
-
80
-
81
-
82
-
83
-
84
-
85
-
86
-
87
-
88
-
89
-
90
-
91
-
92
-
93
-
94
-
95
-
96
-
97
-
98
-
99
-
100
-
101
-
102
-
103
-
104
-
105
-
106
-
107
-
108
-
109
-
110
-
111
-
112
-
113
-
114
-
115
-
116
-
117
-
118
-
119
-
120
-
121
-
122
-
123
-
124
-
125
-
 126
126 -
 127
127 -
 128
128 -
 129
129 -
 130
130 -
 131
131 -
 132
132 -
 133
133 -
 134
134 -
 135
135 -
 136
136 -
 137
137 -
 138
138 -
 139
139 -
 140
140 -
 141
141 -
 142
142 -
 143
143 -
 144
144 -
 145
145 -
 146
146 -
147
-
148
-
149
-
150
-
151
-
152
-
153
-
154
-
155
-
156
-
157
-
158
-
159
-
160
-
161
-
162
-
163
-
164
-
165
-
166
-
167
-
168
-
169
-
170
-
171
-
172
-
173
-
174
-
175
-
176
-
177
-
178
-
179
-
180
-
181
-
182
-
183
-
184
-
185
-
186
-
187
-
188
-
189
-
190
-
191
-
192
-
193
-
194
-
195
-
196
-
197
-
198
-
199
-
200
-
201
-
202
-
203
-
204
-
205
-
206
-
207
-
208
-
209
-
210
-
211
-
212
-
213
-
214
-
215
-
216
-
217
-
218
-
219
-
220
 |
 |

45
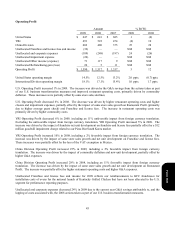
Operating Profit
Amount % B/(W)
2009 2008
2007 2009 2008
United States
$
647 $ 641 $ 685 1 (6 )
YRI 491 522 474 (6
)
10
China Division 602 480 375 25 28
Unallocated Franchise and license fees and income (32
)
— — NM NM
Unallocated and corporate expenses (189
)
(248 ) (197 ) 24 (26 )
Unallocated Impairment expense (26 ) — — NM NM
Unallocated Other income (expense) 71 117 9 NM NM
Unallocated Refranchising gain (loss) 26 5 11 NM NM
Operating Profit
$
1,590 $ 1,517 $ 1,357 5 12
United States operating margin 14.5
%
12.5
%
13.2 % 2.0 ppts. (0.7
)
ppts.
International Division operating margin 18.1
%
17.1
%
15.4 % 1.0 ppts. 1.7 ppts.
U.S. Operating Profit increased 1% in 2009. The increase was driven by the G&A savings from the actions taken as part
of our U.S. business transformation measures and improved restaurant operating costs, primarily driven by commodity
deflation. These increases were partially offset by same store sales declines.
U.S. Operating Profit decreased 6% in 2008. The decrease was driven by higher restaurant operating costs and higher
closure and impairment expenses, partially offset by the impact of same store sales growth on Restaurant Profit (primarily
due to higher average guest check) and Franchise and license fees. The increase in restaurant operating costs was
primarily driven by higher commodity costs.
YRI Operating Profit decreased 6% in 2009, including an 11% unfavorable impact from foreign currency translation.
Excluding the unfavorable impact from foreign currency translation, YRI Operating Profit increased 5% in 2009. The
increase was driven by the impact of franchise net unit development on franchise and license fees partially offset by a $12
million goodwill impairment charge related to our Pizza Hut South Korea market.
YRI Operating Profit increased 10% in 2008, including a 2% favorable impact from foreign currency translation. The
increase was driven by the impact of same store sales growth and net unit development on Franchise and license fees.
These increases were partially offset by the loss of the VAT exemption in Mexico.
China Division Operating Profit increased 25% in 2009, including a 2% favorable impact from foreign currency
translation. The increase was driven by the impact of commodity deflation and new unit development, partially offset by
higher G&A expenses.
China Division Operating Profit increased 28% in 2008, including an 11% favorable impact from foreign currency
translation. The increase was driven by the impact of same store sales growth and net unit development on Restaurant
Profit. The increase was partially offset by higher restaurant operating costs and higher G&A expenses.
Unallocated Franchise and license fees and income for 2009 reflects our reimbursements to KFC franchisees for
installation costs of ovens for the national launch of Kentucky Grilled Chicken that have not been allocated to the U.S.
segment for performance reporting purposes.
Unallocated and corporate expenses decreased 24% in 2009 due to the current year G&A savings attributable to, and the
lapping of costs associated with, the 2008 actions taken as part of our U.S. business transformation measures.
Form 10-K