Pizza Hut 2009 Annual Report Download - page 111
Download and view the complete annual report
Please find page 111 of the 2009 Pizza Hut annual report below. You can navigate through the pages in the report by either clicking on the pages listed below, or by using the keyword search tool below to find specific information within the annual report.-
 1
1 -
2
-
3
-
4
-
5
-
6
-
7
-
8
-
9
-
10
-
11
-
12
-
13
-
14
-
15
-
16
-
17
-
18
-
19
-
20
-
21
-
22
-
23
-
24
-
25
-
26
-
27
-
28
-
29
-
30
-
31
-
32
-
33
-
34
-
35
-
36
-
37
-
38
-
39
-
40
-
41
-
42
-
43
-
44
-
45
-
46
-
47
-
48
-
49
-
50
-
51
-
52
-
53
-
54
-
55
-
56
-
57
-
58
-
59
-
60
-
61
-
62
-
63
-
64
-
65
-
66
-
67
-
68
-
69
-
70
-
71
-
72
-
73
-
74
-
75
-
76
-
77
-
78
-
79
-
80
-
81
-
82
-
83
-
84
-
85
-
86
-
87
-
88
-
89
-
90
-
91
-
92
-
93
-
94
-
95
-
96
-
97
-
98
-
99
-
100
-
 101
101 -
 102
102 -
 103
103 -
 104
104 -
 105
105 -
 106
106 -
 107
107 -
 108
108 -
 109
109 -
 110
110 -
 111
111 -
 112
112 -
 113
113 -
 114
114 -
 115
115 -
 116
116 -
 117
117 -
 118
118 -
 119
119 -
 120
120 -
 121
121 -
122
-
123
-
124
-
125
-
126
-
127
-
128
-
129
-
130
-
131
-
132
-
133
-
134
-
135
-
136
-
137
-
138
-
139
-
140
-
141
-
142
-
143
-
144
-
145
-
146
-
147
-
148
-
149
-
150
-
151
-
152
-
153
-
154
-
155
-
156
-
157
-
158
-
159
-
160
-
161
-
162
-
163
-
164
-
165
-
166
-
167
-
168
-
169
-
170
-
171
-
172
-
173
-
174
-
175
-
176
-
177
-
178
-
179
-
180
-
181
-
182
-
183
-
184
-
185
-
186
-
187
-
188
-
189
-
190
-
191
-
192
-
193
-
194
-
195
-
196
-
197
-
198
-
199
-
200
-
201
-
202
-
203
-
204
-
205
-
206
-
207
-
208
-
209
-
210
-
211
-
212
-
213
-
214
-
215
-
216
-
217
-
218
-
219
-
220
 |
 |

20
PART II
Item 5. Market for the Registrant’s Common Stock, Related Stockholder Matters and Issuer Purchases of
Equity Securities.
The Company’s Common Stock trades under the symbol YUM and is listed on the New York Stock Exchange (“NYSE”).
The following sets forth the high and low NYSE composite closing sale prices by quarter for the Company’s Common
Stock and dividends per common share.
2009
Quarter High Low
Dividends
Declared
Dividends
Paid
First $ 32.87
$ 23.47
$
—
$ 0.19
Second 36.64
27.48 0.38 0.19
Third 36.56
32.57
—
0.19
Fourth 36.06
32.50 0.42 0.21
2008
Quarter High Low
Dividends
Declared
Dividends
Paid
First $ 39.00 $ 33.12 $ 0.15 $ 0.15
Second 41.34 36.85 0.19 0.15
Third 38.68 33.78
—
0.19
Fourth 39.23 22.25 0.38 0.19
In 2008, the Company declared one cash dividend of $0.15 per share of Common Stock and three cash dividends of $0.19
per share of Common Stock, one of which was paid in 2009. In 2009, the Company declared two cash dividends of $0.19
per share and two cash dividends of $0.21 per share of Common Stock, one of which had a distribution date of February
5, 2010. The Company is targeting an annual dividend payout ratio of 35% to 40% of net income.
As of February 10, 2010, there were approximately 77,000 registered holders of record of the Company’s Common Stock.
The Company had no sales of unregistered securities during 2009, 2008 or 2007.
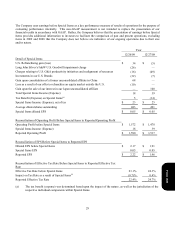
Issuer Purchases of Equity Securities
For the year ended December 26, 2009, there were no shares of Common Stock repurchased by the Company.
In September 2009, our Board of Directors authorized share repurchases of up to $300 million (excluding applicable
transaction fees) of our outstanding Common Stock. This authorization expires in September 2010.
Form 10-K