Pizza Hut 2009 Annual Report Download - page 134
Download and view the complete annual report
Please find page 134 of the 2009 Pizza Hut annual report below. You can navigate through the pages in the report by either clicking on the pages listed below, or by using the keyword search tool below to find specific information within the annual report.-
 1
1 -
2
-
3
-
4
-
5
-
6
-
7
-
8
-
9
-
10
-
11
-
12
-
13
-
14
-
15
-
16
-
17
-
18
-
19
-
20
-
21
-
22
-
23
-
24
-
25
-
26
-
27
-
28
-
29
-
30
-
31
-
32
-
33
-
34
-
35
-
36
-
37
-
38
-
39
-
40
-
41
-
42
-
43
-
44
-
45
-
46
-
47
-
48
-
49
-
50
-
51
-
52
-
53
-
54
-
55
-
56
-
57
-
58
-
59
-
60
-
61
-
62
-
63
-
64
-
65
-
66
-
67
-
68
-
69
-
70
-
71
-
72
-
73
-
74
-
75
-
76
-
77
-
78
-
79
-
80
-
81
-
82
-
83
-
84
-
85
-
86
-
87
-
88
-
89
-
90
-
91
-
92
-
93
-
94
-
95
-
96
-
97
-
98
-
99
-
100
-
101
-
102
-
103
-
104
-
105
-
106
-
107
-
108
-
109
-
110
-
111
-
112
-
113
-
114
-
115
-
116
-
117
-
118
-
119
-
120
-
121
-
122
-
123
-
 124
124 -
 125
125 -
 126
126 -
 127
127 -
 128
128 -
 129
129 -
 130
130 -
 131
131 -
 132
132 -
 133
133 -
 134
134 -
 135
135 -
 136
136 -
 137
137 -
 138
138 -
 139
139 -
 140
140 -
 141
141 -
 142
142 -
 143
143 -
 144
144 -
145
-
146
-
147
-
148
-
149
-
150
-
151
-
152
-
153
-
154
-
155
-
156
-
157
-
158
-
159
-
160
-
161
-
162
-
163
-
164
-
165
-
166
-
167
-
168
-
169
-
170
-
171
-
172
-
173
-
174
-
175
-
176
-
177
-
178
-
179
-
180
-
181
-
182
-
183
-
184
-
185
-
186
-
187
-
188
-
189
-
190
-
191
-
192
-
193
-
194
-
195
-
196
-
197
-
198
-
199
-
200
-
201
-
202
-
203
-
204
-
205
-
206
-
207
-
208
-
209
-
210
-
211
-
212
-
213
-
214
-
215
-
216
-
217
-
218
-
219
-
220
 |
 |

43
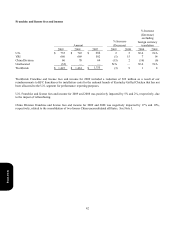
General and Administrative Expenses
The decreases in U.S. and Unallocated G&A expenses for 2009 were driven by the actions taken as part of our U.S.
business transformation measures.
In 2008, the decrease in U.S. G&A expenses was driven by refranchising company stores. The increase in Unallocated
G&A expense was driven by approximately $49 million of charges associated with G&A productivity initiatives and
realignment of resources related to the U.S. business transformation measures.
The increase in YRI G&A expenses for 2009, excluding the impact of foreign currency translation, was driven by
increased costs in strategic growth markets, primarily driven by increased headcount.
In 2008, the decrease in YRI G&A expenses, excluding the impact of foreign currency translation, was driven by a
reduction in convention and training expenses, as well as legal fees.
The increases in China Division G&A expenses for 2009 and 2008, excluding the impact of foreign currency translation,
were driven by increased compensation costs resulting from higher headcount in mainland China.
Worldwide Franchise and License Expenses
Franchise and license expenses increased 19% in 2009. The increase was driven by quality control initiatives, increased
provision for U.S. past due receivables (primarily at KFC and LJS) and higher international franchise convention costs.
Franchise and license expenses increased 67% in 2008. The increase was driven by higher marketing funding on behalf
of franchisees, investments in our U.S. brands related to the U.S. business transformation measures and increased
provision for past due receivables.
Amount
% Increase
(Decrease)
% Increase
(Decrease)
excluding
foreign currency
translation
2009 2008
2007 2009 2008 2009 2008
U.S.
$
482
$
547
$
564
(
12
)
(
3
)
N/A N/A
YRI 341 371 381
(
8
)
(
3
)
2
(
3
)
China Division 209 186 151 12 24 11 16
Unallocated 189 238 197
(
21
)
21 N/A N/A
Worldwide
$
1
,
221
$
1
,
342
$
1,293
(
9
)
4
(
6
)
3
Form 10-K