Pizza Hut 2009 Annual Report Download - page 130
Download and view the complete annual report
Please find page 130 of the 2009 Pizza Hut annual report below. You can navigate through the pages in the report by either clicking on the pages listed below, or by using the keyword search tool below to find specific information within the annual report.-
 1
1 -
2
-
3
-
4
-
5
-
6
-
7
-
8
-
9
-
10
-
11
-
12
-
13
-
14
-
15
-
16
-
17
-
18
-
19
-
20
-
21
-
22
-
23
-
24
-
25
-
26
-
27
-
28
-
29
-
30
-
31
-
32
-
33
-
34
-
35
-
36
-
37
-
38
-
39
-
40
-
41
-
42
-
43
-
44
-
45
-
46
-
47
-
48
-
49
-
50
-
51
-
52
-
53
-
54
-
55
-
56
-
57
-
58
-
59
-
60
-
61
-
62
-
63
-
64
-
65
-
66
-
67
-
68
-
69
-
70
-
71
-
72
-
73
-
74
-
75
-
76
-
77
-
78
-
79
-
80
-
81
-
82
-
83
-
84
-
85
-
86
-
87
-
88
-
89
-
90
-
91
-
92
-
93
-
94
-
95
-
96
-
97
-
98
-
99
-
100
-
101
-
102
-
103
-
104
-
105
-
106
-
107
-
108
-
109
-
110
-
111
-
112
-
113
-
114
-
115
-
116
-
117
-
118
-
119
-
 120
120 -
 121
121 -
 122
122 -
 123
123 -
 124
124 -
 125
125 -
 126
126 -
 127
127 -
 128
128 -
 129
129 -
 130
130 -
 131
131 -
 132
132 -
 133
133 -
 134
134 -
 135
135 -
 136
136 -
 137
137 -
 138
138 -
 139
139 -
 140
140 -
141
-
142
-
143
-
144
-
145
-
146
-
147
-
148
-
149
-
150
-
151
-
152
-
153
-
154
-
155
-
156
-
157
-
158
-
159
-
160
-
161
-
162
-
163
-
164
-
165
-
166
-
167
-
168
-
169
-
170
-
171
-
172
-
173
-
174
-
175
-
176
-
177
-
178
-
179
-
180
-
181
-
182
-
183
-
184
-
185
-
186
-
187
-
188
-
189
-
190
-
191
-
192
-
193
-
194
-
195
-
196
-
197
-
198
-
199
-
200
-
201
-
202
-
203
-
204
-
205
-
206
-
207
-
208
-
209
-
210
-
211
-
212
-
213
-
214
-
215
-
216
-
217
-
218
-
219
-
220
 |
 |

39
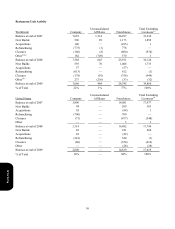
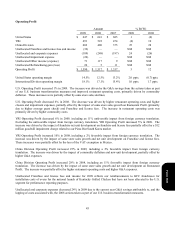
Company Operated Store Results
The following tables detail the key drivers of the year-over-year changes of Company Sales and Restaurant Profit. Store
portfolio actions represent the net impact of new unit openings, acquisitions, refranchisings and store closures on
Company Sales or Restaurant Profit. The impact of new unit openings and acquisitions represent the actual Company
Sales or Restaurant Profit for the periods the Company operated the restaurants in the current year but did not operate
them in the prior year. The impact of refranchisings and store closures represent the actual Company Sales or Restaurant
Profit for the periods in the prior year while the Company operated the restaurants but did not operate them in the current
year.
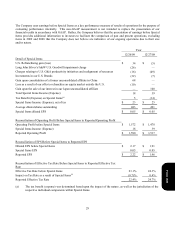
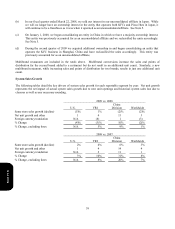
The dollar changes in Company Restaurant Profit by year were as follows:
U.S.
2009 vs. 2008
Income / (Expense)
2008
Store
Portfolio
Actions Other FX 2009
Company Sales $ 4,410 $ (515 ) $ (157 ) $ N/
A
$ 3,738
Cost of Sales (1,335) 158 107 N/
A
(1,070)
Cost of Labor (1,329) 157 51 N/
A
(1,121)
Occupancy and Other (1,195) 154 13 N/A (1,028)
Restaurant Profit
$
551
$
(
46
)
$
14
$
N/
A
$
519
Restaurant Margin 12.5% 13.9%
2008 vs. 2007
Income / (Expense)
2007
Store
Portfolio
Actions Other FX 2008
Company Sales $ 4,518 $ (242 ) $ 134 $ N/
A
$ 4,410
Cost of Sales (1,317) 75 (93 ) N/
A
(1,335)
Cost of Labor (1,377) 75 (27 ) N/
A
(1,329)
Occupancy and Other (1,221) 77 (51 ) N/A (1,195)
Restaurant Profit
$
603
$
(
15
)
$
(
37
)
$
N/
A
$
551
Restaurant Margin 13.3% 12.5%
In 2009, the decrease in U.S. Company Sales and Restaurant Profit associated with store portfolio actions was primarily
driven by refranchising. Significant other factors impacting Company Sales and/or Restaurant Profit were Company same
store sales decline of 4%, commodity deflation of $28 million (primarily cheese), and cost savings associated with
productivity initiatives.
In 2008, the decrease in U.S. Company Sales and Restaurant Profit associated with store portfolio actions was primarily
driven by refranchising. Significant other factors impacting Company Sales and/or Restaurant Profit were Company same
store sales growth of 3%, commodity inflation of $119 million (primarily cheese, meat, chicken and wheat costs), higher
labor costs (primarily wage rate and salary increases) and higher property and casualty insurance expense as we lapped
favorability recognized in 2007.
Form 10-K