Pizza Hut 2009 Annual Report Download - page 190
Download and view the complete annual report
Please find page 190 of the 2009 Pizza Hut annual report below. You can navigate through the pages in the report by either clicking on the pages listed below, or by using the keyword search tool below to find specific information within the annual report.-
 1
1 -
2
-
3
-
4
-
5
-
6
-
7
-
8
-
9
-
10
-
11
-
12
-
13
-
14
-
15
-
16
-
17
-
18
-
19
-
20
-
21
-
22
-
23
-
24
-
25
-
26
-
27
-
28
-
29
-
30
-
31
-
32
-
33
-
34
-
35
-
36
-
37
-
38
-
39
-
40
-
41
-
42
-
43
-
44
-
45
-
46
-
47
-
48
-
49
-
50
-
51
-
52
-
53
-
54
-
55
-
56
-
57
-
58
-
59
-
60
-
61
-
62
-
63
-
64
-
65
-
66
-
67
-
68
-
69
-
70
-
71
-
72
-
73
-
74
-
75
-
76
-
77
-
78
-
79
-
80
-
81
-
82
-
83
-
84
-
85
-
86
-
87
-
88
-
89
-
90
-
91
-
92
-
93
-
94
-
95
-
96
-
97
-
98
-
99
-
100
-
101
-
102
-
103
-
104
-
105
-
106
-
107
-
108
-
109
-
110
-
111
-
112
-
113
-
114
-
115
-
116
-
117
-
118
-
119
-
120
-
121
-
122
-
123
-
124
-
125
-
126
-
127
-
128
-
129
-
130
-
131
-
132
-
133
-
134
-
135
-
136
-
137
-
138
-
139
-
140
-
141
-
142
-
143
-
144
-
145
-
146
-
147
-
148
-
149
-
150
-
151
-
152
-
153
-
154
-
155
-
156
-
157
-
158
-
159
-
160
-
161
-
162
-
163
-
164
-
165
-
166
-
167
-
168
-
169
-
170
-
171
-
172
-
173
-
174
-
175
-
176
-
177
-
178
-
179
-
 180
180 -
 181
181 -
 182
182 -
 183
183 -
 184
184 -
 185
185 -
 186
186 -
 187
187 -
 188
188 -
 189
189 -
 190
190 -
 191
191 -
 192
192 -
 193
193 -
 194
194 -
 195
195 -
 196
196 -
 197
197 -
 198
198 -
 199
199 -
 200
200 -
201
-
202
-
203
-
204
-
205
-
206
-
207
-
208
-
209
-
210
-
211
-
212
-
213
-
214
-
215
-
216
-
217
-
218
-
219
-
220
 |
 |

99
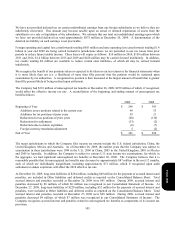
A summary of award activity as of December 26, 2009, and changes during the year then ended is presented below.
Shares
W
eighted-Average
Exercise
Price
Weighted-
Average
Remaining
Contractual Term
Aggregate
Intrinsic Value
(in millions)
Outstanding at the beginning of the year 46,918
$
20.55
Granted 7,766 29.30
Exercised (10,646 ) 12.82
Forfeited or expired (2,373
)
30.46
Outstanding at the end of the year 41,665
$
23.59 5.78
$
502
Exercisable at the end of the year 25,127
$
18.74 4.20
$
420
The weighted-average grant-date fair value of awards granted during 2009, 2008 and 2007 was $7.29, $10.91 and $8.85,
respectively. The total intrinsic value of stock options and SARs exercised during the years ended December 26, 2009,
December 27, 2008 and December 29, 2007, was $217 million, $145 million and $238 million, respectively.
As of December 26, 2009, there was $93 million of unrecognized compensation cost, which will be reduced by any
forfeitures that occur, related to unvested awards that is expected to be recognized over a remaining weighted-average
period of 2.6 years. The total fair value at grant date of awards vested during 2009, 2008 and 2007 was $56 million, $54
million and $57 million, respectively.
The total compensation expense for stock options and SARs recognized was $48 million, $51 million and $56 million in
2009, 2008 and 2007, respectively. The related tax benefit recognized from this expense was $16 million, $17 million and
$19 million in 2009, 2008 and 2007, respectively.
Cash received from stock options exercises for 2009, 2008 and 2007, was $113 million, $72 million and $112 million,
respectively. Tax benefits realized on our tax returns from tax deductions associated with stock options and SARs
exercised for 2009, 2008 and 2007 totaled $57 million, $40 million and $76 million, respectively.
While historically the Company has repurchased shares of our Common Stock on the open market to satisfy award
exercises, we did not repurchase shares during 2009.
In January 2008, we granted an award of 187,398 restricted stock units to our Chief Executive Officer (“CEO”). The
award was made under the LTIPs. The award vests after four years and had a market value of $7.0 million as of January
24, 2008. The award is being expensed over the four year vesting period. The award will be paid to our CEO in shares of
YUM common stock six months following his retirement provided that he does not leave the company before the award
vests. We recognized $2 million of expense in both 2009 and 2008.
In 2009 we modified our long-term incentive compensation program for certain executives, including our CEO, Chief
Financial Officer and our operating segment Presidents. As part of these changes we granted 78,499 performance share
units, with a total grant date fair value of $2.3 million, under the LTIPs. The awards vest after three years and are being
expensed over this period. The ultimate number of shares to be issued is contingent upon the achievement of certain
performance conditions with a maximum payout of 156,998 shares. Total expense recognized in 2009 for these awards
was $0.8 million. Additionally, these executives are no longer eligible to participate in the matching stock program under
our Executive Income Deferral Program as described in Note 17.
Form 10-K