Pizza Hut 2009 Annual Report Download - page 116
Download and view the complete annual report
Please find page 116 of the 2009 Pizza Hut annual report below. You can navigate through the pages in the report by either clicking on the pages listed below, or by using the keyword search tool below to find specific information within the annual report.-
 1
1 -
2
-
3
-
4
-
5
-
6
-
7
-
8
-
9
-
10
-
11
-
12
-
13
-
14
-
15
-
16
-
17
-
18
-
19
-
20
-
21
-
22
-
23
-
24
-
25
-
26
-
27
-
28
-
29
-
30
-
31
-
32
-
33
-
34
-
35
-
36
-
37
-
38
-
39
-
40
-
41
-
42
-
43
-
44
-
45
-
46
-
47
-
48
-
49
-
50
-
51
-
52
-
53
-
54
-
55
-
56
-
57
-
58
-
59
-
60
-
61
-
62
-
63
-
64
-
65
-
66
-
67
-
68
-
69
-
70
-
71
-
72
-
73
-
74
-
75
-
76
-
77
-
78
-
79
-
80
-
81
-
82
-
83
-
84
-
85
-
86
-
87
-
88
-
89
-
90
-
91
-
92
-
93
-
94
-
95
-
96
-
97
-
98
-
99
-
100
-
101
-
102
-
103
-
104
-
105
-
 106
106 -
 107
107 -
 108
108 -
 109
109 -
 110
110 -
 111
111 -
 112
112 -
 113
113 -
 114
114 -
 115
115 -
 116
116 -
 117
117 -
 118
118 -
 119
119 -
 120
120 -
 121
121 -
 122
122 -
 123
123 -
 124
124 -
 125
125 -
 126
126 -
127
-
128
-
129
-
130
-
131
-
132
-
133
-
134
-
135
-
136
-
137
-
138
-
139
-
140
-
141
-
142
-
143
-
144
-
145
-
146
-
147
-
148
-
149
-
150
-
151
-
152
-
153
-
154
-
155
-
156
-
157
-
158
-
159
-
160
-
161
-
162
-
163
-
164
-
165
-
166
-
167
-
168
-
169
-
170
-
171
-
172
-
173
-
174
-
175
-
176
-
177
-
178
-
179
-
180
-
181
-
182
-
183
-
184
-
185
-
186
-
187
-
188
-
189
-
190
-
191
-
192
-
193
-
194
-
195
-
196
-
197
-
198
-
199
-
200
-
201
-
202
-
203
-
204
-
205
-
206
-
207
-
208
-
209
-
210
-
211
-
212
-
213
-
214
-
215
-
216
-
217
-
218
-
219
-
220
 |
 |

25
Segment Reporting Changes
In the first quarter of 2010 we will begin reporting information for our Thailand and KFC Taiwan businesses within our
International Division as a result of changes to our management reporting structure. The China Division will only consist
of operations in mainland China and the International Division will include the remainder of our international operations.
While our consolidated results will not be impacted, we will restate our historical segment information during 2010 for
consistent presentation. All forward looking information within this MD&A reflects these changes in our reporting
structure.
In connection with our U.S. business transformation measures our reported segment results began reflecting increased
allocations of certain expenses in 2009 that were previously reported as unallocated and corporate G&A expenses. While
our consolidated results were not impacted, we believe the revised allocation better aligns costs with accountability of our
segment managers. These revised allocations are being used by our Chairman and Chief Executive Officer, in his role as
chief operating decision maker, in his assessment of operating performance. We have restated segment information for
the years ended December 27, 2008 and December 29, 2007 to be consistent with the current period presentation.
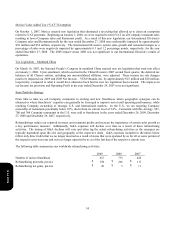
T
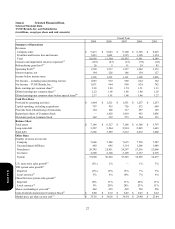
he following table summarizes the 2008 and 2007 impact of the revised allocations by segment:
Increase/(Decrease) 2008 2007
U.S. G&A $ 53 $ 54
YRI G&A 6 6
Unallocated and corporate G&A expenses (59 ) (60
)
Strategies
The Company continues to focus on four key strategies:
Build Leading Brands in China in Every Significant Category – The Company has developed the KFC and Pizza Hut
brands into the leading quick service and casual dining restaurants, respectively, in mainland China. Additionally, the
Company owns and operates the distribution system for its restaurants in mainland China which we believe provides a
significant competitive advantage. Given this strong competitive position, a growing economy and a population of 1.3
billion in mainland China, the Company is rapidly adding KFC and Pizza Hut Casual Dining restaurants and testing the
additional restaurant concepts of Pizza Hut Home Service (pizza delivery) and East Dawning (Chinese food). Our
ongoing earnings growth model in mainland China is driven by new unit development each year and modest same store
sales growth, which we expect to drive annual Operating Profit growth of 15%.
Drive Aggressive International Expansion and Build Strong Brands Everywhere – The Company and its franchisees
opened approximately 900 new restaurants in 2009 in the Company’s International Division, representing 10 straight
years of opening over 700 restaurants, and is the leading international retail developer in terms of units opened. The
Company expects to continue to experience strong growth by building out existing markets and growing in new markets
including France, Russia and India. The International Division’s Operating Profit has experienced a 7 year compound
annual growth rate of 11%. Our ongoing earnings growth model includes annual Operating Profit growth of 10% driven
by new unit development, modest same store sales growth, modest margin improvement and leverage of our General and
Administrative (“G&A”) infrastructure for YRI.
Form 10-K