Pizza Hut 2009 Annual Report Download - page 152
Download and view the complete annual report
Please find page 152 of the 2009 Pizza Hut annual report below. You can navigate through the pages in the report by either clicking on the pages listed below, or by using the keyword search tool below to find specific information within the annual report.-
 1
1 -
2
-
3
-
4
-
5
-
6
-
7
-
8
-
9
-
10
-
11
-
12
-
13
-
14
-
15
-
16
-
17
-
18
-
19
-
20
-
21
-
22
-
23
-
24
-
25
-
26
-
27
-
28
-
29
-
30
-
31
-
32
-
33
-
34
-
35
-
36
-
37
-
38
-
39
-
40
-
41
-
42
-
43
-
44
-
45
-
46
-
47
-
48
-
49
-
50
-
51
-
52
-
53
-
54
-
55
-
56
-
57
-
58
-
59
-
60
-
61
-
62
-
63
-
64
-
65
-
66
-
67
-
68
-
69
-
70
-
71
-
72
-
73
-
74
-
75
-
76
-
77
-
78
-
79
-
80
-
81
-
82
-
83
-
84
-
85
-
86
-
87
-
88
-
89
-
90
-
91
-
92
-
93
-
94
-
95
-
96
-
97
-
98
-
99
-
100
-
101
-
102
-
103
-
104
-
105
-
106
-
107
-
108
-
109
-
110
-
111
-
112
-
113
-
114
-
115
-
116
-
117
-
118
-
119
-
120
-
121
-
122
-
123
-
124
-
125
-
126
-
127
-
128
-
129
-
130
-
131
-
132
-
133
-
134
-
135
-
136
-
137
-
138
-
139
-
140
-
141
-
 142
142 -
 143
143 -
 144
144 -
 145
145 -
 146
146 -
 147
147 -
 148
148 -
 149
149 -
 150
150 -
 151
151 -
 152
152 -
 153
153 -
 154
154 -
 155
155 -
 156
156 -
 157
157 -
 158
158 -
 159
159 -
 160
160 -
 161
161 -
 162
162 -
163
-
164
-
165
-
166
-
167
-
168
-
169
-
170
-
171
-
172
-
173
-
174
-
175
-
176
-
177
-
178
-
179
-
180
-
181
-
182
-
183
-
184
-
185
-
186
-
187
-
188
-
189
-
190
-
191
-
192
-
193
-
194
-
195
-
196
-
197
-
198
-
199
-
200
-
201
-
202
-
203
-
204
-
205
-
206
-
207
-
208
-
209
-
210
-
211
-
212
-
213
-
214
-
215
-
216
-
217
-
218
-
219
-
220
 |
 |

61
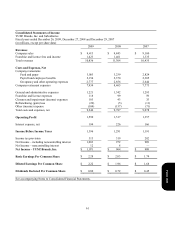
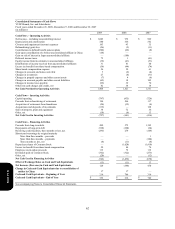
Consolidated Statements of Income
YUM! Brands, Inc. and Subsidiaries
Fiscal years ended December 26, 2009, December 27, 2008 and December 29, 2007
(in millions, except per share data)
2009 2008 2007
Revenues
Company sales
$
9,413 $ 9,843 $ 9,100
Franchise and license fees and income 1,423 1,461 1,335
Total revenues 10,836 11,304 10,435
Costs and Expenses, Net
Company restaurants
Food and paper 3,003 3,239 2,824
Payroll and employee benefits 2,154 2,370 2,305
Occupancy and other operating expenses 2,777 2,856 2,644
Company restaurant expenses 7,934 8,465 7,773
General and administrative expenses 1,221 1,342 1,293
Franchise and license expenses 118 99 59
Closures and impairment (income) expenses 103 43 35
Refranchising (gain) loss (26 ) (5 ) (11 )
Other (income) expense (104 ) (157 ) (71 )
Total costs and expenses, net 9,246 9,787 9,078
Operating Profit 1,590 1,517 1,357
Interest expense, net 194 226 166
Income Before Income Taxes 1,396 1,291 1,191
Income tax provision 313 319 282
N
et Income – including noncontrolling interest 1,083 972 909
N
et Income – noncontrolling interest 12 8
—
Net Income – YUM! Brands, Inc.
$
1,071 $ 964 $ 909
Basic Earnings Per Common Share
$
2.28 $ 2.03 $ 1.74
Diluted Earnings Per Common Share
$
2.22 $ 1.96 $ 1.68
Dividends Declared Per Common Share
$
0.80 $ 0.72 $ 0.45
See accompanying Notes to Consolidated Financial Statements.
Form 10-K