Pizza Hut 2009 Annual Report Download - page 2
Download and view the complete annual report
Please find page 2 of the 2009 Pizza Hut annual report below. You can navigate through the pages in the report by either clicking on the pages listed below, or by using the keyword search tool below to find specific information within the annual report.-
 1
1 -
 2
2 -
 3
3 -
 4
4 -
 5
5 -
 6
6 -
 7
7 -
 8
8 -
 9
9 -
 10
10 -
 11
11 -
 12
12 -
 13
13 -
14
-
15
-
16
-
17
-
18
-
19
-
20
-
21
-
22
-
23
-
24
-
25
-
26
-
27
-
28
-
29
-
30
-
31
-
32
-
33
-
34
-
35
-
36
-
37
-
38
-
39
-
40
-
41
-
42
-
43
-
44
-
45
-
46
-
47
-
48
-
49
-
50
-
51
-
52
-
53
-
54
-
55
-
56
-
57
-
58
-
59
-
60
-
61
-
62
-
63
-
64
-
65
-
66
-
67
-
68
-
69
-
70
-
71
-
72
-
73
-
74
-
75
-
76
-
77
-
78
-
79
-
80
-
81
-
82
-
83
-
84
-
85
-
86
-
87
-
88
-
89
-
90
-
91
-
92
-
93
-
94
-
95
-
96
-
97
-
98
-
99
-
100
-
101
-
102
-
103
-
104
-
105
-
106
-
107
-
108
-
109
-
110
-
111
-
112
-
113
-
114
-
115
-
116
-
117
-
118
-
119
-
120
-
121
-
122
-
123
-
124
-
125
-
126
-
127
-
128
-
129
-
130
-
131
-
132
-
133
-
134
-
135
-
136
-
137
-
138
-
139
-
140
-
141
-
142
-
143
-
144
-
145
-
146
-
147
-
148
-
149
-
150
-
151
-
152
-
153
-
154
-
155
-
156
-
157
-
158
-
159
-
160
-
161
-
162
-
163
-
164
-
165
-
166
-
167
-
168
-
169
-
170
-
171
-
172
-
173
-
174
-
175
-
176
-
177
-
178
-
179
-
180
-
181
-
182
-
183
-
184
-
185
-
186
-
187
-
188
-
189
-
190
-
191
-
192
-
193
-
194
-
195
-
196
-
197
-
198
-
199
-
200
-
201
-
202
-
203
-
204
-
205
-
206
-
207
-
208
-
209
-
210
-
211
-
212
-
213
-
214
-
215
-
216
-
217
-
218
-
219
-
220
 |
 |

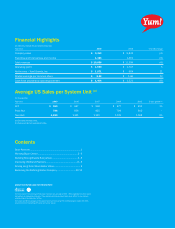
Financial Highlights
(In millions, except for per share amounts)
Year-end 2009 2008 % B/(W) change
Company sales $ 9,413 $ 9,843 (4)
Franchise and license fees and income 1,423 1,461 (3)
Total revenues $ 10,836 $ 11,304 (4)
Operating profit $ 1,590 $ 1,517 5
Net income – Yum! Brands, Inc. $ 1,071 $ 964 11
Diluted earnings per common share $ 2.22 $ 1.96 13
Cash flows provided by operating activities $ 1,404 $ 1,521 (8)
Average US Sales per System Unit (a)
(In thousands)
Year-end 2009 2008 2007 2006 2005 5-year growth (b)
KFC $ 960 $ 967 $ 994 $ 977 $ 954 1%
Pizza Hut 786 854 825 794 810 –
Taco Bell 1,229 1,241 1,120 1,176 1,168 3%
(a) Excludes license units.
(b) Compounded annual growth rate.
Contents
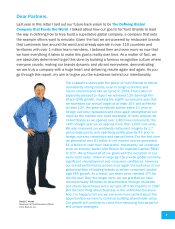
Dear Partners ............................................................................1
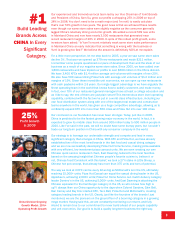
Winning Big in China! ............................................................. 2–3
Building Strong Brands Everywhere ..................................... 4–5
Improving US Brand Positions ..................................................6–8
Driving Long-Term Shareholder Value.......................................... 9
Becoming the Defining Global Company .............................10-12
About the pAper used for this report
The inks used in the printing of this report contain an average of 25% - 35% vegetable oils from plant
derivatives, a renewable resource. They replace petroleum based inks as an effort to also reduce
volatile organic compounds (VOCs).
The cover and rst 12 pages of this report were printed using FSC-certied paper made with 50%
recycled content including 24% post-consumer waste.